Observability: Logs, Metrics, Traces and Production Debugging
Learn observability for distributed systems: logs, metrics, traces, SLOs, dashboards, alerting, OpenTelemetry, and debugging tradeoffs.
Quick answer: Observability: Logs, Metrics, Traces and Production Debugging
Observability: Logs, Metrics, Traces and Production Debugging is covered here as a practical system design concept. Learn observability for distributed systems: logs, metrics, traces, SLOs, dashboards, alerting, OpenTelemetry, and debugging tradeoffs. Use it to understand the Distributed Systems idea, where it appears in production systems, and how to discuss it clearly in interviews.
Focus on the problem being solved, the main design choice, the failure mode, and the tradeoff you would defend in front of a senior engineer. This page is part of the DosiBridge system design knowledge graph, so it links related concepts, interview problems, tradeoffs, and references instead of leaving the topic isolated.
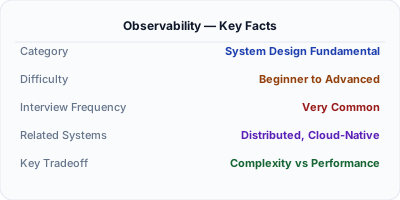
Observability is the ability to understand a system's internal state by examining its external outputs — logs, metrics, and traces. While monitoring tells you when something is wrong, observability helps you understand why. In distributed systems with dozens of interconnected services, observability is essential for debugging issues that span multiple service boundaries. The three pillars of observability — logs, metrics, and traces — provide complementary views that together enable engineers to diagnose any problem without deploying new code.
| Aspect | Details |
|---|---|
| What it is | The ability to infer a system's internal state from its external telemetry outputs — logs, metrics, and traces |
| When to use | Always in distributed systems — you cannot debug what you cannot see, and microservices create emergent behaviors no single team predicts |
| When NOT to use | When running a single-process monolith in development where a debugger and printf statements suffice for troubleshooting |
| Real-world example | Uber built their own observability platform (M3 for metrics, Jaeger for traces) to diagnose issues across thousands of microservices |
| Interview tip | Define the three pillars clearly and explain how they complement each other — logs give detail, metrics give trends, traces give causality |
| Common mistake | Collecting massive volumes of telemetry without indexing or sampling — raw data is expensive to store and impossible to query at scale |
| Key tradeoff | Cost vs. insight — comprehensive observability is expensive in storage and compute, but blind spots during incidents cost more |
Why This Matters
Distributed systems exhibit emergent behavior — failures arise from interactions between services that are individually healthy. A 50ms latency increase in one service might cause timeouts in another, triggering retries that overload a third. Traditional monitoring dashboards cannot explain these cascading interactions. Observability provides the tools to ask arbitrary questions about system behavior: which user IDs experienced errors, what percentage of requests to endpoint X touched slow database Y, why did latency spike for only one availability zone. Without observability, debugging incidents in production becomes guesswork. OpenTelemetry has emerged as the industry standard for collecting and correlating all three pillars.
The Building Blocks
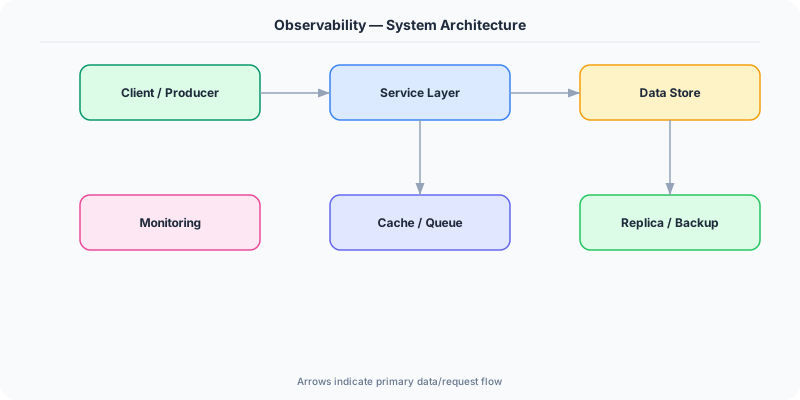
- Logs: Discrete timestamped event records with structured fields, providing detailed context about what happened at specific moments in each service
- Metrics: Numeric time-series measurements (counters, gauges, histograms) aggregated over time, revealing trends and enabling alerting on system health
- Traces: End-to-end request paths through distributed services, showing the causal chain and timing of every operation a request triggers
- Correlation: Linking logs, metrics, and traces together via shared identifiers (trace IDs, span IDs) so engineers can pivot between telemetry types during investigation
- Instrumentation: The code and libraries that generate telemetry data — auto-instrumentation captures common patterns while manual instrumentation covers business-specific signals
Under the Hood
Observability rests on generating, collecting, and correlating three complementary signal types. Logs record discrete events — a user logged in, a query failed, a cache missed. Structured logging formats events as JSON with consistent fields, making them queryable. Metrics aggregate numeric values over time — request count, error rate, p99 latency. They are cheap to store and excellent for dashboards and alerts. Traces record the journey of a single request across service boundaries, creating a directed acyclic graph of spans that reveals where time was spent.
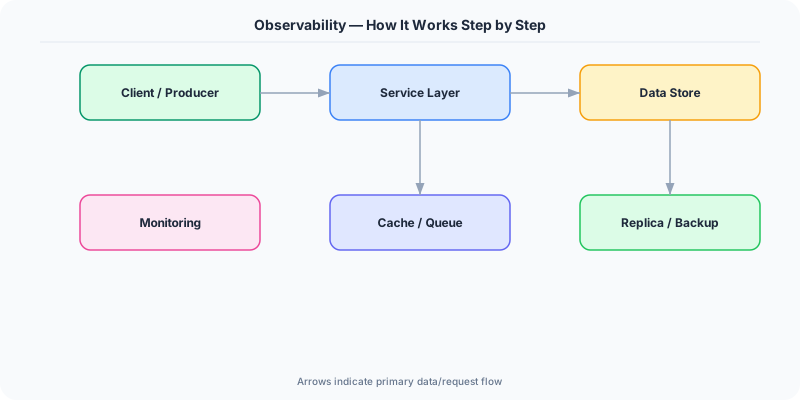
The key innovation in modern observability is correlation. When a trace ID is embedded in every log line and tagged on every metric, an engineer investigating a latency spike can go from a dashboard (metrics) to the specific slow traces, then drill into the detailed logs for the offending spans. OpenTelemetry standardizes this by providing a single SDK that emits all three signals with consistent context propagation.
Achieving cost-effective observability requires intelligent sampling and aggregation. Head-based sampling decides at ingress whether to trace a request (simple but misses interesting failures). Tail-based sampling buffers trace data and only persists traces that exhibit anomalies — high latency, errors, or unusual patterns. This dramatically reduces storage costs while preserving the most valuable diagnostic data.
How Companies Actually Do This
Uber Built Jaeger for distributed tracing and M3 for metrics aggregation, processing billions of spans and metrics daily across thousands of microservices to debug rider-driver matching issues
Netflix Developed Edgar, an observability platform that correlates logs, traces, and metrics per request, enabling engineers to debug streaming issues from a single pane of glass
Honeycomb Pioneered high-cardinality observability, allowing engineers to query across any combination of dimensions without pre-defined dashboards to find novel failure patterns
Common Pitfalls
- Treating observability as just monitoring with more data — the value is in the ability to ask novel questions, not in building more static dashboards
- Insufficient context propagation — if trace IDs do not flow through async queues and batch jobs, you lose visibility at the boundaries that matter most
- Over-instrumenting everything at maximum verbosity crushes storage budgets; under-instrumenting misses critical signals — start with RED metrics and expand
Interview Questions Worth Practicing
- How do the three pillars of observability complement each other when debugging a production incident?
- What is the difference between monitoring and observability, and when does monitoring fall short?
- How would you design an observability strategy for a new microservices platform with a limited budget?
The Tradeoffs
- Depth vs. Cost: Comprehensive telemetry provides deep insight but generates enormous data volumes that are expensive to store, index, and query
- Sampling vs. Completeness: Sampling reduces cost dramatically but may miss rare edge-case failures that only appear in unsampled requests
- Standardization vs. Flexibility: OpenTelemetry provides vendor-neutral standards but may not expose vendor-specific features of tools like Datadog or Honeycomb
How to Explain This in an Interview
Here is how I would explain Observability in a system design interview:
Observability is the ability to understand a distributed system's internal state from its external outputs. It rests on three pillars: logs provide event-level detail, metrics provide aggregated trends and alerting, and traces show the end-to-end journey of requests across services. The key is correlation — embedding trace IDs in logs and metric tags so you can pivot from a dashboard anomaly to the specific traces and log lines that explain it. OpenTelemetry has become the industry standard for instrumentation. I would start with RED metrics (Rate, Errors, Duration) for every service, add distributed tracing with tail-based sampling to control costs, and use structured logging with trace context for deep debugging.
Related Topics
Original DosiBridge notes for Observability: Logs, Metrics, Traces and Production Debugging
This section is written specifically for this page, not copied from a general system-design checklist. The useful way to study Observability: Logs, Metrics, Traces and Production Debugging is to connect the concept to a production service where growth exposes the first weak assumption in the original design. That framing changes the design discussion from definitions to operating choices.
What makes this topic distinct
- Membership: For Observability: Logs, Metrics, Traces and Production Debugging, decide the membership before choosing tools; otherwise the design looks clean but fails when observability changes.
- Clock Drift: For Observability: Logs, Metrics, Traces and Production Debugging, decide the clock drift before choosing tools; otherwise the design looks clean but fails when observability changes.
- Retry Semantics: For Observability: Logs, Metrics, Traces and Production Debugging, decide the retry semantics before choosing tools; otherwise the design looks clean but fails when observability changes.
- Partition Behavior: For Observability: Logs, Metrics, Traces and Production Debugging, decide the partition behavior before choosing tools; otherwise the design looks clean but fails when observability changes.
- Reconciliation: For Observability: Logs, Metrics, Traces and Production Debugging, decide the reconciliation before choosing tools; otherwise the design looks clean but fails when observability changes.
Production review question
If a team adopts Observability: Logs, Metrics, Traces and Production Debugging, what observable signal proves it helped instead of only making the architecture diagram more fashionable?
Practical metric to track
Track observability health as a named dashboard or review item: combine one user-facing metric, one saturation metric, and one correctness metric. For Observability: Logs, Metrics, Traces and Production Debugging, this keeps the discussion grounded in behavior that can be measured after deployment instead of generic advice that sounds good in an interview but never gets verified.