Metrics: Counters, Gauges, Histograms and SLO Monitoring
Learn metrics for distributed systems: counters, gauges, histograms, RED/USE methods, cardinality, dashboards, alerting, and capacity planning.
Quick answer: Metrics: Counters, Gauges, Histograms and SLO Monitoring
Metrics: Counters, Gauges, Histograms and SLO Monitoring is covered here as a practical system design concept. Learn metrics for distributed systems: counters, gauges, histograms, RED/USE methods, cardinality, dashboards, alerting, and capacity planning. Use it to understand the Distributed Systems idea, where it appears in production systems, and how to discuss it clearly in interviews.
Focus on the problem being solved, the main design choice, the failure mode, and the tradeoff you would defend in front of a senior engineer. This page is part of the DosiBridge system design knowledge graph, so it links related concepts, interview problems, tradeoffs, and references instead of leaving the topic isolated.
Metrics are numeric measurements collected at regular intervals that describe system behavior over time. Unlike logs which record individual events, metrics aggregate data into time-series — request counts, error rates, latency percentiles, CPU utilization — that reveal trends, trigger alerts, and power dashboards. The three fundamental metric types are counters (monotonically increasing totals), gauges (point-in-time values), and histograms (distributions). Metrics are the most cost-effective observability signal because aggregated numbers are far cheaper to store and query than individual events.
| Aspect | Details |
|---|---|
| What it is | Numeric time-series measurements (counters, gauges, histograms) that quantify system behavior for dashboards, alerting, and capacity planning |
| When to use | Always in production — metrics are the first signal for detecting problems and the primary input for alerts, SLOs, and autoscaling decisions |
| When NOT to use | When you need to understand the specific details of individual requests — use logs or traces for event-level granularity |
| Real-world example | Prometheus, created at SoundCloud, became the industry standard for metrics collection in cloud-native environments and Kubernetes |
| Interview tip | Explain the RED method (Rate, Errors, Duration) for services and USE method (Utilization, Saturation, Errors) for resources — shows structured thinking |
| Common mistake | Using averages instead of percentiles — an average latency of 100ms hides the fact that 1% of users experience 5-second responses |
| Key tradeoff | Cardinality vs. utility — high-cardinality labels provide detailed breakdowns but explode storage and query costs in time-series databases |
Why This Matters
Metrics answer the fundamental question: is the system healthy right now, and how does today compare to yesterday? A single Prometheus counter tracking HTTP requests can tell you the request rate, error rate, and availability — the core health indicators for any service. Histograms reveal latency distributions, showing that while median latency is 50ms, the p99 is 2 seconds, meaning 1% of users have a terrible experience. Metrics are essential for alerting (page me if error rate exceeds 1%), capacity planning (we need to add servers before traffic doubles next quarter), and autoscaling (scale up when CPU exceeds 70%). Without metrics, you are flying blind — unable to set SLOs, detect degradation, or justify infrastructure investments.
The Building Blocks
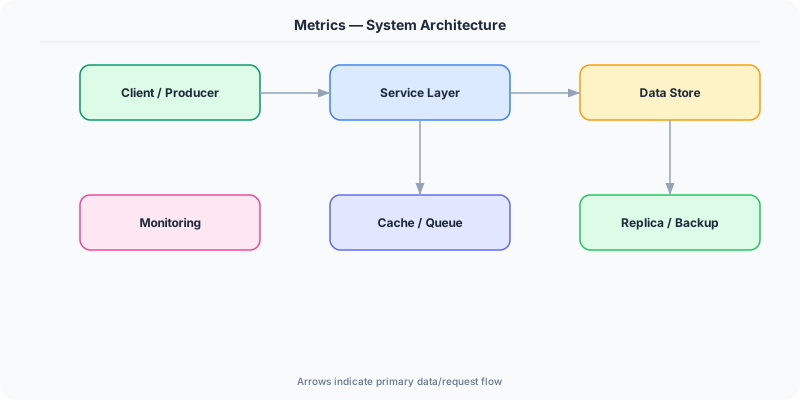
- Counters: Monotonically increasing values that only go up — total requests served, total errors, total bytes processed — rate is computed at query time
- Gauges: Point-in-time values that can go up or down — current CPU utilization, active connections, queue depth, memory usage
- Histograms: Distribution measurements that bucket observations into ranges — request latency distribution enabling percentile calculations like p50, p95, p99
- Labels and Dimensions: Key-value tags attached to metrics (service, endpoint, status_code, region) enabling slicing and filtering of aggregated data
- Collection and Storage: Pull-based (Prometheus scrapes endpoints) or push-based (StatsD, OTLP) collection into time-series databases optimized for write-heavy numeric workloads
Under the Hood
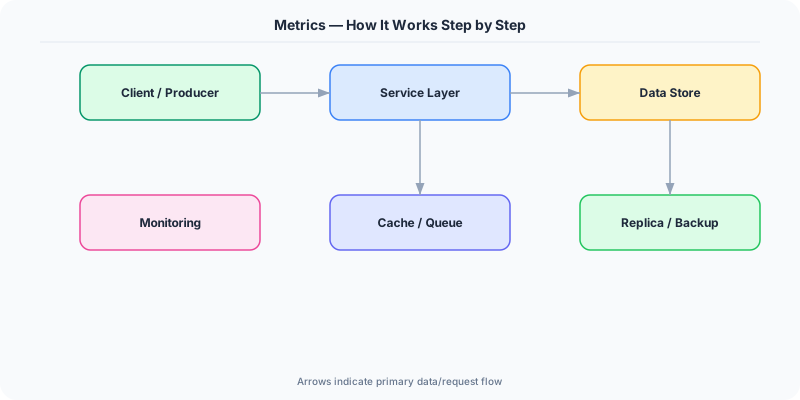
Metrics work through a pipeline of instrumentation, collection, storage, and visualization. At the instrumentation layer, applications expose metric values through libraries. Prometheus client libraries expose an HTTP /metrics endpoint that the Prometheus server scrapes at configured intervals (typically 15-30 seconds). Each scrape captures the current value of all registered metrics.
Counters are the simplest and most useful type. A counter tracking total HTTP requests might show a value of 1,000,000. The rate() function in PromQL calculates the per-second rate of change, giving you requests per second. Error counters divided by request counters give error rates. Histograms are more complex — they maintain configurable buckets (0-10ms, 10-50ms, 50-100ms, 100-500ms, 500ms+) and count observations per bucket, enabling percentile calculation without storing individual values.
The cardinality challenge is the primary operational concern. Each unique combination of metric name and label values creates a distinct time series. A metric with labels for service (10 values), endpoint (50 values), status_code (5 values), and region (3 values) creates 10 × 50 × 5 × 3 = 7,500 time series. Adding a userId label with 1 million users would create 7.5 billion series, overwhelming any time-series database. Cardinality must be carefully controlled — use logs for high-cardinality dimensions and metrics only for bounded label sets.
How Companies Actually Do This
SoundCloud Created Prometheus to solve metrics collection at scale, which became a CNCF graduated project and the de facto standard for Kubernetes monitoring
Netflix Uses Atlas, their custom time-series database, to ingest millions of metrics per second from streaming infrastructure, enabling real-time dashboards and automated anomaly detection
Uber Built M3, an open-source metrics platform handling billions of time series, to aggregate metrics from thousands of microservices across multiple data centers
Common Pitfalls
- Using averages for latency metrics instead of percentiles — the average masks tail latency problems; always track p50, p95, and p99 at minimum
- High-cardinality label explosion (adding user IDs or request IDs as metric labels) which overwhelms time-series database storage and query performance
- Not defining clear metric naming conventions across teams, leading to inconsistent dashboards where http_requests_total and request_count_http mean the same thing
Interview Questions Worth Practicing
- What are the three fundamental metric types and when would you use each one?
- How does the RED method guide you in choosing which metrics to instrument for a service?
- What is the cardinality problem in metrics and how do you prevent it from crashing your monitoring infrastructure?
The Tradeoffs
- Granularity vs. Cost: Higher scrape frequency and more labels provide finer-grained data but increase storage, query latency, and infrastructure costs
- Simplicity vs. Accuracy: Counters and gauges are simple but histograms give percentiles — you need both, and choosing bucket boundaries for histograms is a design decision
- Pull vs. Push: Pull-based (Prometheus) is simple for service mesh but fails for short-lived jobs; push-based (StatsD/OTLP) works everywhere but requires push infrastructure
How to Explain This in an Interview
Here is how I would explain Metrics in a system design interview:
Metrics are numeric time-series measurements that quantify system behavior. The three types are counters (monotonically increasing, like total requests), gauges (current values, like active connections), and histograms (distributions, like latency percentiles). I follow the RED method for services — Rate, Errors, Duration — and the USE method for resources — Utilization, Saturation, Errors. Prometheus is the industry standard, scraping /metrics endpoints. The critical pitfall is cardinality: each unique label combination creates a time series, so adding unbounded labels like userId explodes storage. I always use percentiles (p50, p95, p99) rather than averages because averages hide tail latency affecting real users.
Related Topics
Original DosiBridge notes for Metrics: Counters, Gauges, Histograms and SLO Monitoring
This section is written specifically for this page, not copied from a general system-design checklist. The useful way to study Metrics: Counters, Gauges, Histograms and SLO Monitoring is to connect the concept to a production service where growth exposes the first weak assumption in the original design. That framing changes the design discussion from definitions to operating choices.
What makes this topic distinct
- Membership: For Metrics: Counters, Gauges, Histograms and SLO Monitoring, decide the membership before choosing tools; otherwise the design looks clean but fails when metrics changes.
- Clock Drift: For Metrics: Counters, Gauges, Histograms and SLO Monitoring, decide the clock drift before choosing tools; otherwise the design looks clean but fails when metrics changes.
- Retry Semantics: For Metrics: Counters, Gauges, Histograms and SLO Monitoring, decide the retry semantics before choosing tools; otherwise the design looks clean but fails when metrics changes.
- Partition Behavior: For Metrics: Counters, Gauges, Histograms and SLO Monitoring, decide the partition behavior before choosing tools; otherwise the design looks clean but fails when metrics changes.
- Reconciliation: For Metrics: Counters, Gauges, Histograms and SLO Monitoring, decide the reconciliation before choosing tools; otherwise the design looks clean but fails when metrics changes.
Production review question
If a team adopts Metrics: Counters, Gauges, Histograms and SLO Monitoring, what observable signal proves it helped instead of only making the architecture diagram more fashionable?
Practical metric to track
Track metrics health as a named dashboard or review item: combine one user-facing metric, one saturation metric, and one correctness metric. For Metrics: Counters, Gauges, Histograms and SLO Monitoring, this keeps the discussion grounded in behavior that can be measured after deployment instead of generic advice that sounds good in an interview but never gets verified.