Logging
Learn structured logging and log levels for distributed systems — capture meaningful context, correlate events across services, and build queryable.
Quick answer: Logging
Logging is covered here as a practical system design concept. Learn structured logging and log levels for distributed systems — capture meaningful context, correlate events across services, and build queryable. Use it to understand the Distributed Systems idea, where it appears in production systems, and how to discuss it clearly in interviews.
Focus on the problem being solved, the main design choice, the failure mode, and the tradeoff you would defend in front of a senior engineer. This page is part of the DosiBridge system design knowledge graph, so it links related concepts, interview problems, tradeoffs, and references instead of leaving the topic isolated.
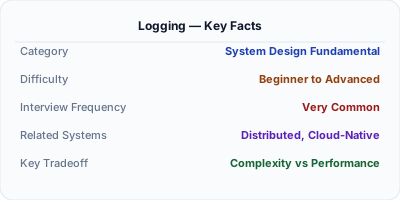
Logging records discrete events as timestamped entries, providing the most detailed view of what happened in a system at any given moment. In distributed systems, structured logging — emitting events as machine-parseable JSON with consistent fields — transforms logs from grep-able text files into a queryable diagnostic database. Combined with log levels (DEBUG, INFO, WARN, ERROR) and centralized aggregation, logging enables engineers to search across millions of events from dozens of services to understand failures that cross service boundaries.
| Aspect | Details |
|---|---|
| What it is | The practice of recording timestamped events from applications with structured fields, log levels, and centralized aggregation for debugging |
| When to use | Always — every service should emit structured logs with request context; logging is the most fundamental observability signal |
| When NOT to use | When you need real-time numeric dashboards or alerting — use metrics instead of trying to derive numbers from log analysis at query time |
| Real-world example | Stripe processes billions of structured log events daily through a centralized pipeline to debug payment processing issues within minutes |
| Interview tip | Mention structured logging specifically and explain why unstructured text logs fail at scale — shows you understand production realities |
| Common mistake | Using string concatenation for log messages instead of structured fields — 'User 123 failed' is ungrepable compared to structured key-value pairs like userId=123, event=auth_failure |
| Key tradeoff | Verbosity vs. cost — detailed logging aids debugging but generates massive storage and ingestion costs at scale |
Why This Matters
Logs are the most detailed observability signal — they capture the exact sequence of events, the specific data involved, and the error messages that explain failures. In a monolith, you might grep a single log file. In a distributed system with 50 services, you need centralized log aggregation (ELK Stack, Datadog, Splunk) with structured fields so you can query: show me all ERROR logs for user X in the last hour across all services. Without structured logging, this query is impossible — unstructured text logs from different services use different formats, field names, and timestamp conventions. Structured logging with consistent schemas and correlation IDs transforms logs into a powerful diagnostic tool that scales with your architecture.
The Building Blocks
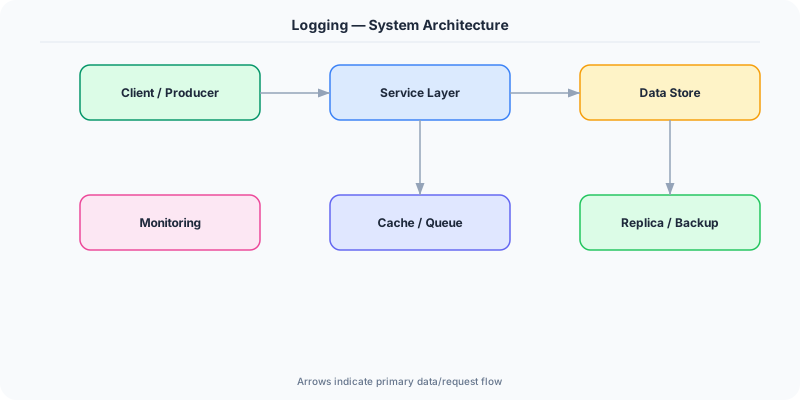
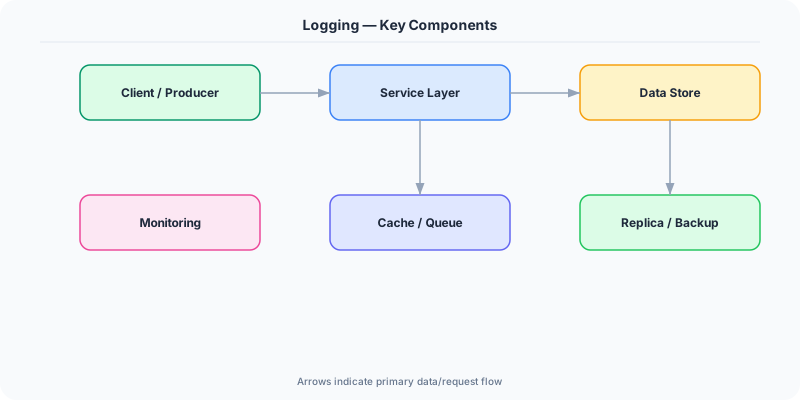
- Log Levels: Severity classifications (TRACE, DEBUG, INFO, WARN, ERROR, FATAL) that control verbosity and enable filtering by importance during incidents
- Structured Fields: Key-value pairs (userId, requestId, duration, statusCode) attached to every log event, enabling precise queries across billions of records
- Log Aggregation: Centralized collection of logs from all services into a single queryable store like Elasticsearch, Loki, or CloudWatch Logs
- Context Propagation: Automatically injecting trace IDs, span IDs, and request metadata into every log line so events can be correlated across service boundaries
- Log Sampling: Reducing log volume by selectively logging based on criteria — always log errors, sample debug logs at 1%, increase verbosity during incidents
Under the Hood
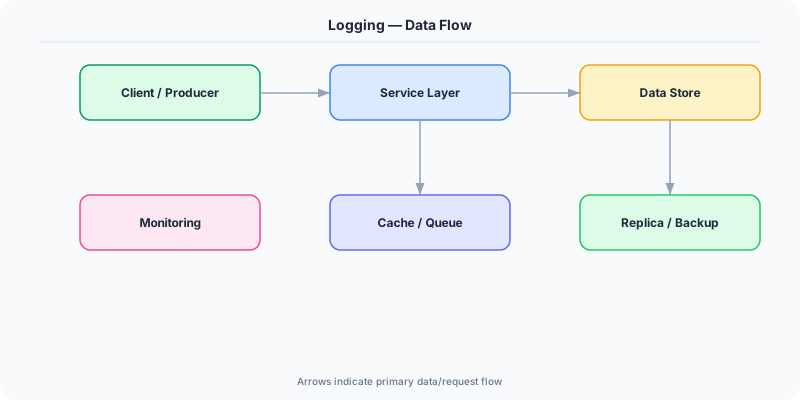
Modern logging pipelines have three stages: emission, collection, and storage. At the emission stage, applications use logging libraries that format events as structured JSON with consistent fields. A well-structured log line includes timestamp, log level, service name, trace ID, span ID, and business-specific fields. This is fundamentally different from printf-style logging because every field is independently queryable.
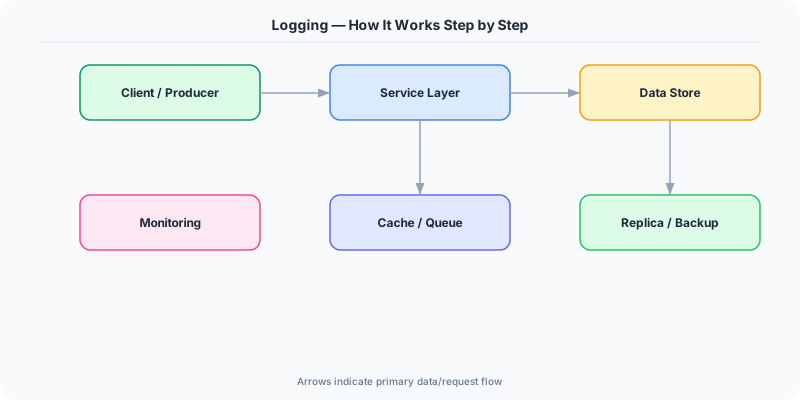
Collection is handled by log agents (Fluentd, Fluent Bit, Logstash, Vector) running on each host. These agents tail log files or receive logs over the network, parse and enrich them (adding hostname, environment, region), and forward them to a centralized store. In Kubernetes, sidecar or DaemonSet collectors automatically capture stdout from every pod.
Storage and querying is where the value is realized. Elasticsearch powers keyword search with inverted indexes. Grafana Loki takes a different approach, indexing only labels and compressing log content, making it much cheaper for high-volume environments. The critical design decision is retention — keeping 30 days of DEBUG logs at scale is prohibitively expensive. Production systems typically retain ERROR logs for months, INFO logs for weeks, and DEBUG logs for days, with the ability to dynamically increase verbosity for specific services during active incidents.
How Companies Actually Do This
Stripe Uses structured logging with request IDs in every event, enabling support engineers to trace a single payment through dozens of internal services within seconds
Netflix Processes petabytes of logs daily through their centralized logging pipeline, using automated pattern detection to identify novel error types before they escalate to incidents
Datadog Pioneered log analytics with automatic pattern clustering, grouping millions of similar log lines into patterns and surfacing anomalous new patterns that may indicate emerging issues
Common Pitfalls
- Logging sensitive data (passwords, tokens, PII) in plaintext — always redact or mask sensitive fields to comply with security and privacy requirements
- Using unstructured string messages ('Error processing order for user John') instead of structured fields (event=order_error, userId=john) makes searching impossible at scale
- Setting all services to DEBUG level in production — the volume overwhelms storage and ingestion systems, increasing costs 10-100x without proportional debugging value
Interview Questions Worth Practicing
- How does structured logging differ from traditional text logging and why does it matter at scale?
- How would you design a log aggregation pipeline for a microservices system with 100 services?
- What log levels would you emit for different types of events, and how would you manage log volume in production?
The Tradeoffs
- Verbosity vs. Cost: More detailed logs help debugging but exponentially increase storage, ingestion, and query costs at high scale
- Structure vs. Developer Effort: Structured logging requires discipline and conventions across teams but pays off enormously in queryability
- Centralized vs. Local: Centralized aggregation enables cross-service queries but introduces a critical dependency and network overhead
How to Explain This in an Interview
Here is how I would explain Logging in a system design interview:
Logging captures discrete timestamped events from applications. In distributed systems, structured logging — emitting JSON with consistent fields like userId, requestId, statusCode — is essential because it transforms logs into a queryable database across services. I would use log levels strategically: ERROR for failures needing attention, WARN for degradation, INFO for key business events, DEBUG for troubleshooting detail. The pipeline involves emission via a structured logging library, collection via agents like Fluentd, and storage in Elasticsearch or Loki. I always include trace IDs in log context so I can correlate logs with distributed traces. Critical considerations include PII redaction, retention policies by level, and dynamic verbosity control during incidents.
Related Topics
Original DosiBridge notes for Logging
This section is written specifically for this page, not copied from a general system-design checklist. The useful way to study Logging is to connect the concept to a production service where growth exposes the first weak assumption in the original design. That framing changes the design discussion from definitions to operating choices.
What makes this topic distinct
- Membership: For Logging, decide the membership before choosing tools; otherwise the design looks clean but fails when logging changes.
- Clock Drift: For Logging, decide the clock drift before choosing tools; otherwise the design looks clean but fails when logging changes.
- Retry Semantics: For Logging, decide the retry semantics before choosing tools; otherwise the design looks clean but fails when logging changes.
- Partition Behavior: For Logging, decide the partition behavior before choosing tools; otherwise the design looks clean but fails when logging changes.
- Reconciliation: For Logging, decide the reconciliation before choosing tools; otherwise the design looks clean but fails when logging changes.
Production review question
If a team adopts Logging, what observable signal proves it helped instead of only making the architecture diagram more fashionable?
Practical metric to track
Track logging health as a named dashboard or review item: combine one user-facing metric, one saturation metric, and one correctness metric. For Logging, this keeps the discussion grounded in behavior that can be measured after deployment instead of generic advice that sounds good in an interview but never gets verified.