Monitoring
Learn Monitoring for distributed systems — build dashboards, set SLOs, configure alerts, and establish processes to detect, diagnose, and respond to.
Quick answer: Monitoring
Monitoring is covered here as a practical system design concept. Learn Monitoring for distributed systems — build dashboards, set SLOs, configure alerts, and establish processes to detect, diagnose, and respond to. Use it to understand the Distributed Systems idea, where it appears in production systems, and how to discuss it clearly in interviews.
Focus on the problem being solved, the main design choice, the failure mode, and the tradeoff you would defend in front of a senior engineer. This page is part of the DosiBridge system design knowledge graph, so it links related concepts, interview problems, tradeoffs, and references instead of leaving the topic isolated.
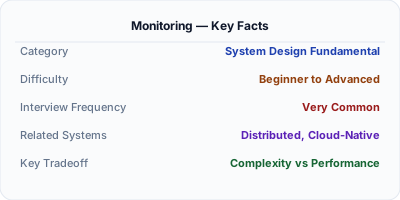
Monitoring is the practice of collecting, visualizing, and alerting on system health metrics to detect problems before they impact users. Dashboards display real-time and historical data — request rates, error rates, latency percentiles, resource utilization. Service Level Objectives (SLOs) define reliability targets, and alerts fire when those targets are at risk. In distributed systems, effective monitoring requires tracking health across dozens of services, their dependencies, and the infrastructure they run on, using a structured approach like RED or USE methods.
| Aspect | Details |
|---|---|
| What it is | The practice of collecting system health data, visualizing it on dashboards, setting SLOs, and alerting when reliability targets are at risk |
| When to use | Always in production systems — monitoring is the minimum viable operational practice for any service that has users |
| When NOT to use | When you need to understand why something failed — monitoring tells you what is wrong, but you need observability (logs, traces) for why |
| Real-world example | Google codified monitoring best practices in the SRE handbook, defining SLIs, SLOs, and error budgets as the foundation for running reliable services |
| Interview tip | Define SLI vs. SLO vs. SLA precisely and explain error budgets — shows you understand Google SRE principles beyond just building dashboards |
| Common mistake | Alert fatigue from too many low-priority alerts — teams start ignoring alerts, and real incidents get missed in the noise |
| Key tradeoff | Signal vs. noise — too few monitors miss real problems, too many create alert fatigue; SLO-based alerting balances this |
Why This Matters
Monitoring is the operational foundation of running production systems. Without it, you discover problems when users complain — which may be hours after the issue started. With monitoring, dashboards show real-time system health, and alerts notify on-call engineers within minutes of degradation. The modern approach centers on Service Level Objectives (SLOs): defining that 99.9% of requests should complete in under 300ms, tracking the error budget (the allowed 0.1% unreliability), and alerting when the burn rate suggests the budget will be exhausted. This approach focuses engineering attention on what matters — user-perceived reliability — rather than arbitrary thresholds on internal metrics. Grafana, Datadog, and New Relic are the dominant monitoring platforms.
The Building Blocks
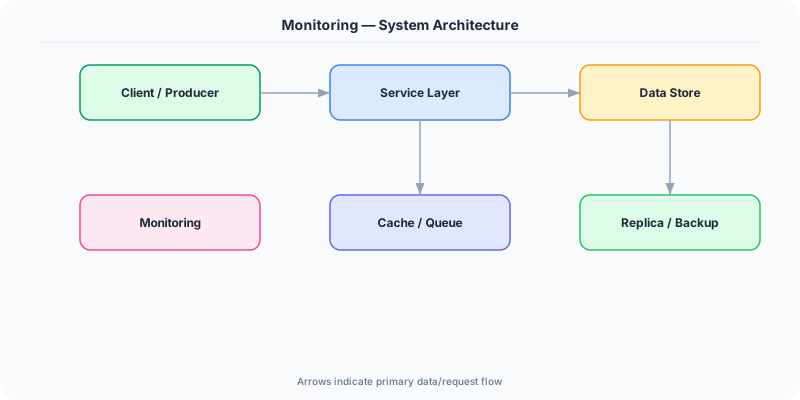
- Service Level Indicators: Measurable metrics that reflect user experience — request latency, error rate, availability — the quantitative inputs to SLO calculations
- Service Level Objectives: Reliability targets expressed as percentages over time windows — 99.9% of requests succeed within 300ms over a rolling 30-day period
- Dashboards: Visual displays of real-time and historical metrics using tools like Grafana, organized by service, team, or user journey for quick health assessment
- Health Checks: Endpoints that report whether a service and its dependencies are functioning correctly, used by load balancers, orchestrators, and monitoring systems
- Error Budgets: The allowed unreliability (100% minus SLO) that teams can spend on feature development versus reliability work, balancing velocity and stability
Under the Hood
Modern monitoring follows a layered approach. At the bottom, infrastructure monitoring tracks host-level metrics — CPU, memory, disk, network — using agents like node_exporter or CloudWatch. Above that, application monitoring tracks service-level metrics using the RED method (Request rate, Error rate, Duration) for request-driven services and the USE method (Utilization, Saturation, Errors) for resources like queues and connection pools.
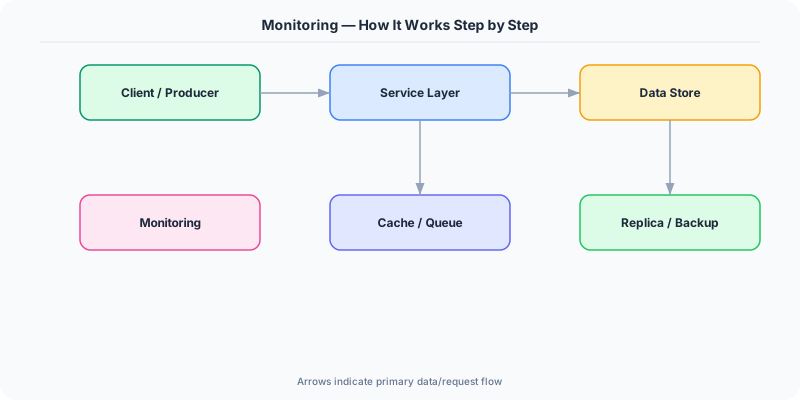
SLO-based monitoring adds a user-centric layer. An SLI might be the proportion of HTTP requests returning 2xx status codes within 300ms. The SLO states this should be 99.9% over 30 days. The error budget is 0.1% — roughly 43 minutes of total downtime or a proportional number of failed requests per month. Multi-window, multi-burn-rate alerting detects when the error budget is being consumed too quickly: a fast burn alert (e.g., 14x burn rate over 1 hour) catches sudden outages, while a slow burn alert (e.g., 2x burn rate over 3 days) catches gradual degradation.
Dashboard design follows information hierarchy. A top-level dashboard shows overall service health across all services. Drilling down reveals per-service dashboards with RED metrics, dependency health, and infrastructure utilization. The most effective dashboards are organized by user journey — showing the complete health of the checkout flow from cart to payment to confirmation — rather than by team ownership, which creates blind spots at service boundaries.
How Companies Actually Do This
Google Pioneered SLO-based monitoring and error budgets through their SRE practice, defining the industry-standard framework for balancing reliability targets with feature development velocity
Grafana Labs Created the open-source Grafana dashboarding platform used by millions of organizations, supporting Prometheus, Loki, and Tempo as a complete monitoring stack
Datadog Built a unified monitoring platform combining infrastructure, application, and log monitoring with AI-powered anomaly detection used by thousands of enterprises
Common Pitfalls
- Alert fatigue from hundreds of low-priority alerts — teams learn to ignore notifications and miss critical incidents; every alert should be actionable and require human intervention
- Dashboard sprawl with hundreds of panels nobody looks at — focus on a few high-signal dashboards aligned with user journeys and SLOs rather than metrics for every internal component
- Setting SLOs without measuring SLIs first — SLOs must be based on real user experience data, not aspirational targets invented in a planning meeting
Interview Questions Worth Practicing
- What is the difference between SLI, SLO, and SLA, and how do error budgets connect them?
- How would you design a monitoring strategy for a new microservices platform with 20 services?
- What is multi-window, multi-burn-rate alerting and why is it better than simple threshold alerts?
The Tradeoffs
- Coverage vs. Noise: More monitors catch more issues but generate more alerts; SLO-based alerting focuses on user impact to reduce noise
- Real-Time vs. Cost: Higher-resolution metrics and faster scrape intervals give quicker detection but increase storage, query, and infrastructure costs
- Centralized vs. Federated: A single monitoring platform simplifies operations but creates a single point of failure; federated monitoring is resilient but harder to correlate
How to Explain This in an Interview
Here is how I would explain Monitoring in a system design interview:
Monitoring is the practice of collecting metrics, visualizing them on dashboards, and alerting when reliability targets are at risk. I follow Google's SRE framework: define SLIs (measurable quality metrics like latency and error rate), set SLOs (99.9% of requests under 300ms), and track error budgets (the 0.1% allowed unreliability). I use multi-window, multi-burn-rate alerting — fast burn catches sudden outages, slow burn catches gradual degradation. Dashboards should be organized by user journey, not team. I instrument services with RED metrics (Rate, Errors, Duration) and resources with USE metrics (Utilization, Saturation, Errors). Every alert must be actionable — if it does not require human intervention, it should not page anyone.
Related Topics
Original DosiBridge notes for Monitoring
This section is written specifically for this page, not copied from a general system-design checklist. The useful way to study Monitoring is to connect the concept to a production service where growth exposes the first weak assumption in the original design. That framing changes the design discussion from definitions to operating choices.
What makes this topic distinct
- Membership: For Monitoring, decide the membership before choosing tools; otherwise the design looks clean but fails when monitoring changes.
- Clock Drift: For Monitoring, decide the clock drift before choosing tools; otherwise the design looks clean but fails when monitoring changes.
- Retry Semantics: For Monitoring, decide the retry semantics before choosing tools; otherwise the design looks clean but fails when monitoring changes.
- Partition Behavior: For Monitoring, decide the partition behavior before choosing tools; otherwise the design looks clean but fails when monitoring changes.
- Reconciliation: For Monitoring, decide the reconciliation before choosing tools; otherwise the design looks clean but fails when monitoring changes.
Production review question
If a team adopts Monitoring, what observable signal proves it helped instead of only making the architecture diagram more fashionable?
Practical metric to track
Track monitoring health as a named dashboard or review item: combine one user-facing metric, one saturation metric, and one correctness metric. For Monitoring, this keeps the discussion grounded in behavior that can be measured after deployment instead of generic advice that sounds good in an interview but never gets verified.