Distributed Tracing: Spans, Trace IDs, OpenTelemetry and Debugging
Learn distributed tracing for microservices: trace IDs, spans, context propagation, OpenTelemetry, latency diagnosis, sampling, and observability tradeoffs.
Quick answer: Distributed Tracing: Spans, Trace IDs, OpenTelemetry and Debugging
Distributed Tracing: Spans, Trace IDs, OpenTelemetry and Debugging is covered here as a practical system design concept. Learn distributed tracing for microservices: trace IDs, spans, context propagation, OpenTelemetry, latency diagnosis, sampling, and observability tradeoffs. Use it to understand the Distributed Systems idea, where it appears in production systems, and how to discuss it clearly in interviews.
Focus on the problem being solved, the main design choice, the failure mode, and the tradeoff you would defend in front of a senior engineer. This page is part of the DosiBridge system design knowledge graph, so it links related concepts, interview problems, tradeoffs, and references instead of leaving the topic isolated.
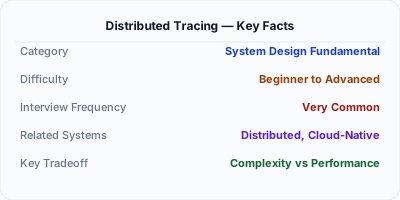
The Core Idea
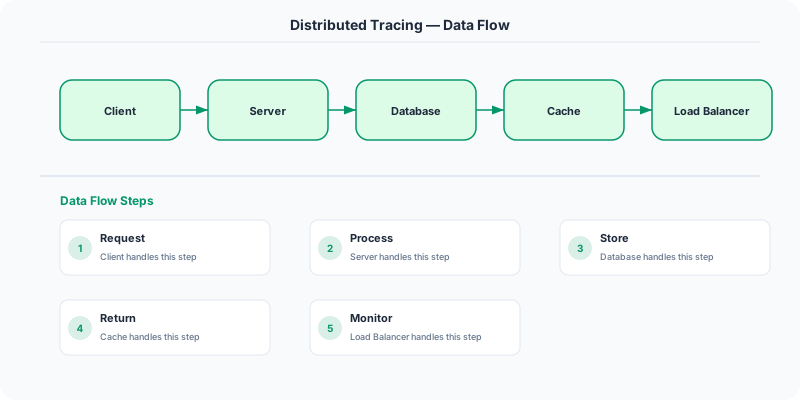
Distributed tracing tracks a request as it flows through multiple services in a microservices architecture. Each service adds a span (a timed operation) to the trace, creating a complete picture of the request's journey, timing, and any errors encountered.
Step-by-Step Walkthrough
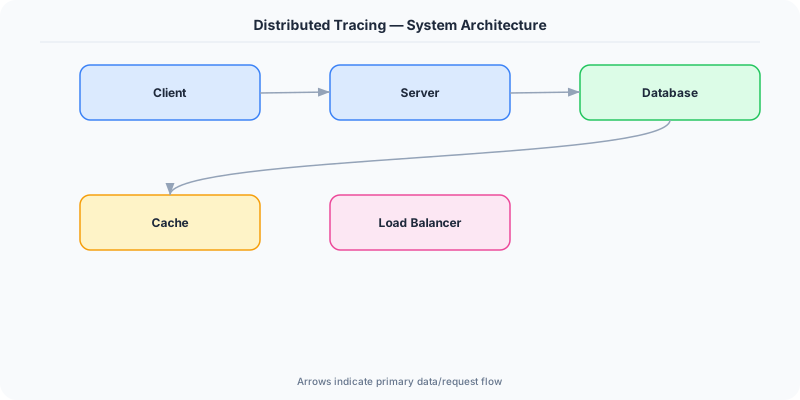
A user request arrives at the API gateway. The gateway generates a trace ID (e.g., abc123) and adds it to the request header. Each service creates a span with start time, end time, and metadata. Spans are sent to a tracing backend (Jaeger, Zipkin, Datadog). The backend assembles spans into a trace, creating a waterfall visualization showing exactly where time was spent.
Why This Approach Wins
- Trace: A complete record of a request's journey through the system. Has a unique trace ID.
- Span: A single operation within a trace (e.g., 'database query took 50ms'). Spans have parent-child relationships.
- Context propagation: The trace ID is passed between services (typically in HTTP headers) so all spans are correlated.
- Sampling: Tracing every request is too expensive. Sample 1-10% of requests. Use head-based or tail-based sampling.
- OpenTelemetry: The industry standard for distributed tracing instrumentation. Supports many languages and backends.
In Production
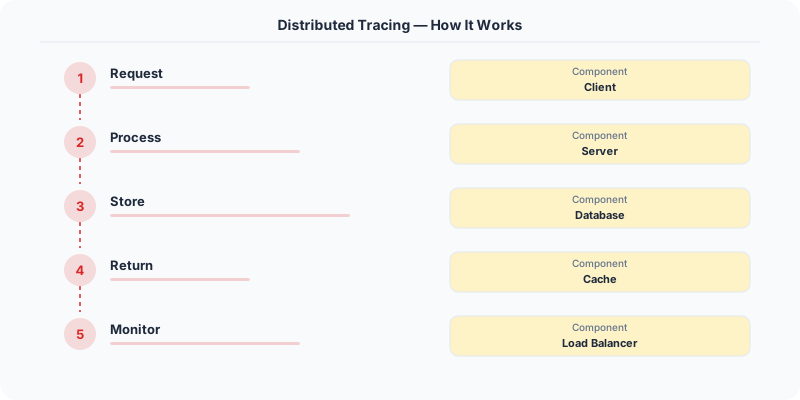
Google Dapper was the pioneering distributed tracing system, tracing requests across Google's millions of servers.
Uber uses Jaeger (which they open-sourced) to trace requests across thousands of microservices.
Netflix traces every request through their microservices using OpenTelemetry, helping identify latency bottlenecks.
Tradeoffs and Limitations
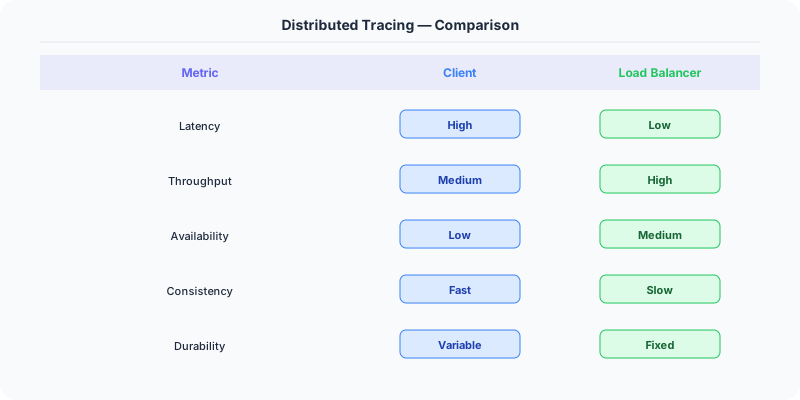
- Overhead vs Visibility: Tracing adds latency (span creation, context propagation) and storage costs.
- Sampling vs Completeness: Sampling misses some slow requests. Tail-based sampling captures slow requests but is more complex.
- Cost: Storing and analyzing traces at scale requires significant infrastructure.
Production Gotchas
- Not propagating trace context — breaks the trace between services
- Tracing 100% of requests — too expensive at scale
- Not correlating traces with logs and metrics — tracing alone does not tell the full story
The Interview Angle
- What is distributed tracing and why is it needed?
- How does context propagation work?
- What is the difference between a trace and a span?
- How do you handle the overhead of tracing?
Next Up
Original DosiBridge notes for Distributed Tracing: Spans, Trace IDs, OpenTelemetry and Debugging
This section is written specifically for this page, not copied from a general system-design checklist. The useful way to study Distributed Tracing: Spans, Trace IDs, OpenTelemetry and Debugging is to connect the concept to a production service where growth exposes the first weak assumption in the original design. That framing changes the design discussion from definitions to operating choices.
What makes this topic distinct
- Membership: For Distributed Tracing: Spans, Trace IDs, OpenTelemetry and Debugging, decide the membership before choosing tools; otherwise the design looks clean but fails when distributed changes.
- Clock Drift: For Distributed Tracing: Spans, Trace IDs, OpenTelemetry and Debugging, decide the clock drift before choosing tools; otherwise the design looks clean but fails when tracing changes.
- Retry Semantics: For Distributed Tracing: Spans, Trace IDs, OpenTelemetry and Debugging, decide the retry semantics before choosing tools; otherwise the design looks clean but fails when distributed changes.
- Partition Behavior: For Distributed Tracing: Spans, Trace IDs, OpenTelemetry and Debugging, decide the partition behavior before choosing tools; otherwise the design looks clean but fails when tracing changes.
- Reconciliation: For Distributed Tracing: Spans, Trace IDs, OpenTelemetry and Debugging, decide the reconciliation before choosing tools; otherwise the design looks clean but fails when distributed changes.
Production review question
If a team adopts Distributed Tracing: Spans, Trace IDs, OpenTelemetry and Debugging, what observable signal proves it helped instead of only making the architecture diagram more fashionable?
Practical metric to track
Track distributed-tracing health as a named dashboard or review item: combine one user-facing metric, one saturation metric, and one correctness metric. For Distributed Tracing: Spans, Trace IDs, OpenTelemetry and Debugging, this keeps the discussion grounded in behavior that can be measured after deployment instead of generic advice that sounds good in an interview but never gets verified.