Latency vs Throughput vs Bandwidth
Confusing latency and throughput is a common interview mistake. A system can have high throughput but high latency (batch processing), or low latency but.
Quick answer: Latency vs Throughput vs Bandwidth
Latency vs Throughput vs Bandwidth is covered here as a practical system design concept. Confusing latency and throughput is a common interview mistake. A system can have high throughput but high latency (batch processing), or low latency but. Use it to understand the Core Concepts idea, where it appears in production systems, and how to discuss it clearly in interviews.
Focus on the problem being solved, the main design choice, the failure mode, and the tradeoff you would defend in front of a senior engineer. This page is part of the DosiBridge system design knowledge graph, so it links related concepts, interview problems, tradeoffs, and references instead of leaving the topic isolated.
The Problem Latency vs Throughput vs Bandwidth Solves
Confusing latency and throughput is a common interview mistake. A system can have high throughput but high latency (batch processing), or low latency but low throughput (a single fast server). Understanding these metrics is essential for capacity planning and system design.
How It Works Under the Hood
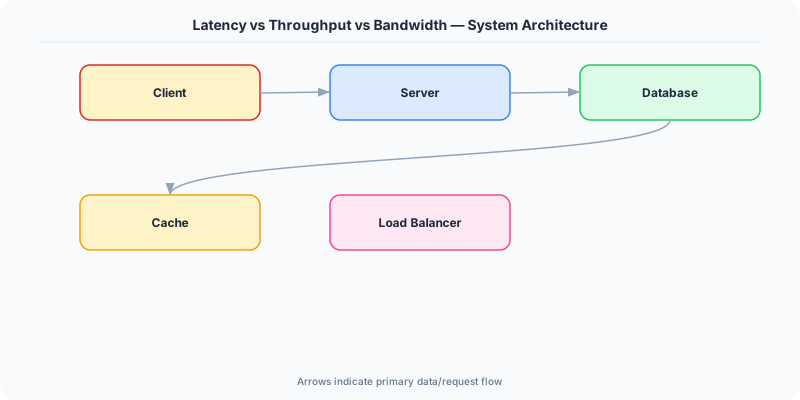
Latency is how long it takes for a single request to complete (measured in milliseconds). Throughput is how many requests the system can handle per unit of time (measured in requests per second). Bandwidth is the maximum amount of data that can be transferred per unit of time (measured in bits per second). These three metrics are related but distinct.
In practice, you optimize for the metric that matters most for your use case. Real-time systems (trading, gaming) optimize for low latency. Data pipelines optimize for high throughput. CDNs optimize for bandwidth.
To improve latency: add caching, move computation closer to users (edge), optimize database queries, reduce network hops. To improve throughput: add more workers, batch operations, use async processing, partition data. To improve bandwidth: compress data, use efficient serialization (protobuf vs JSON), upgrade network links.
The Mental Model
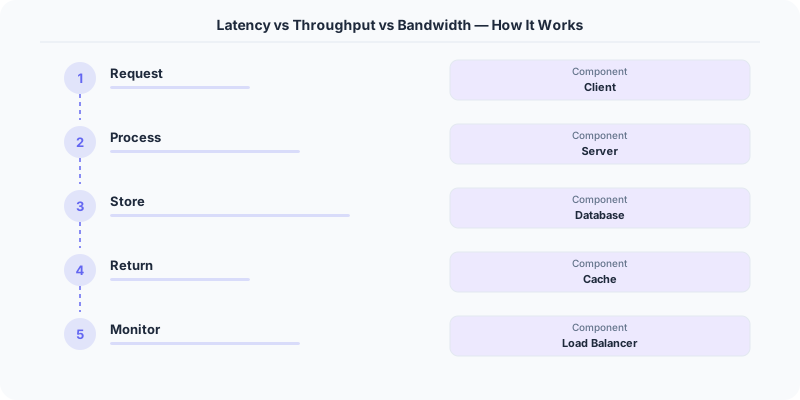
- Latency = time per operation: p50 latency is the median, p99 is the 99th percentile (only 1% of requests are slower). Focus on tail latency (p99) because it affects user experience.
- Throughput = operations per time: Measured in QPS (queries per second), TPS (transactions per second), or RPS (requests per second).
- Bandwidth = pipe capacity: Like a highway — bandwidth is the number of lanes, latency is the speed limit, throughput is the number of cars per hour.
- Little's Law: Concurrency = Throughput × Latency. If each request takes 100ms and you handle 1000 QPS, you need 100 concurrent connections.
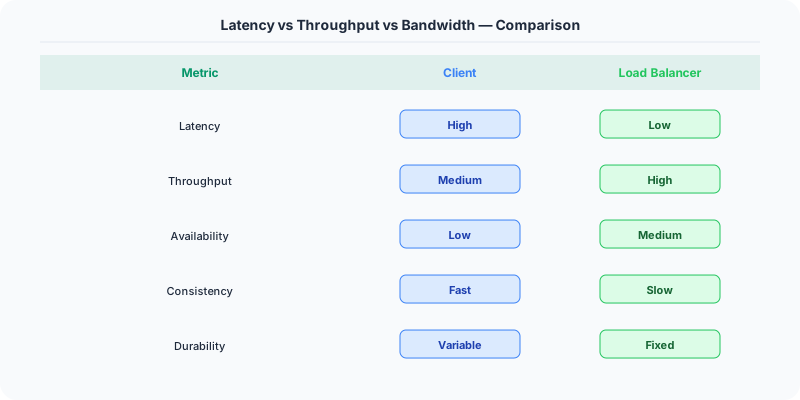
- They can trade off: Batching increases throughput but increases latency. Caching reduces latency but may reduce consistency.
Real Systems That Depend on This
Google Search targets <200ms latency because studies show that 100ms of added latency reduces revenue by 1%.
Apache Kafka is optimized for throughput — it can process millions of messages per second by batching writes and using sequential I/O.
Akamai CDN provides high bandwidth by caching content at 300,000+ edge servers worldwide.
Where This Shows Up in Interviews
- What is the difference between latency and throughput?
- How would you optimize a system for low latency vs high throughput?
- What is tail latency and why does it matter?
- How does Little's Law apply to system design?
Tradeoffs
- Latency vs. Throughput: Batching improves throughput but increases latency for individual items.
- Bandwidth vs. Latency: Compressing data reduces bandwidth usage but adds latency for compression/decompression.
- Cost vs. Performance: Low-latency solutions (in-memory databases, edge computing) are more expensive.
Watch Out For
- Quoting average latency instead of percentiles — p50 hides tail latency problems
- Confusing bandwidth with throughput — bandwidth is theoretical max, throughput is actual achieved rate
- Optimizing for latency when throughput is the bottleneck, or vice versa
Go Deeper
- Caching — start here if this is new to you
- CDN
- Load Balancing
- latency-vs-throughput-tradeoff
Production angle: latency and throughput are queueing problems
Latency and throughput are often explained as "time per request" versus "requests per second", but production systems fail because teams optimize one without understanding the queue behind it. A service can process high throughput while individual users wait too long, or it can respond quickly at low traffic and collapse as soon as queues form.
The useful mental model is: latency is what one user feels; throughput is what the system completes over time; queue depth explains why both change under load.
How to reason from metrics
- p50 latency shows the normal experience.
- p95 and p99 latency show tail behavior from queues, locks, GC pauses, slow disks, noisy neighbors, or downstream calls.
- Throughput shows completed work, not attempted work. Failed requests and timeouts should be measured separately.
- Concurrency is in-flight work. If concurrency rises while throughput stays flat, the system is probably queueing.
- Utilization near 100% is dangerous because small bursts create large waiting time.
Concrete example
Imagine a payment API that normally completes in 80 ms at 300 requests per second. During a campaign it receives 900 requests per second. If the database can only commit 500 writes per second, the web servers may still accept connections and show high CPU efficiency, but the queue before the database grows. Users experience 3-second or 8-second tail latency even though average throughput looks impressive on a dashboard.
The fix is not always "add more app servers". You might need idempotency keys, write batching, a queue with explicit user state, database partitioning, caching for reads, or backpressure that rejects excess traffic quickly instead of letting it time out slowly.
Interview answer pattern
When asked about latency and throughput, do not stop at definitions. Explain the target SLO, expected traffic, bottleneck resource, p95/p99 latency, and overload behavior. A senior answer mentions what happens when demand exceeds capacity: backpressure, rate limits, load shedding, queue limits, autoscaling delay, and graceful degradation.
Architecture checklist
- Define p95 or p99 latency SLO for user-facing paths.
- Measure throughput as successful completed operations per second.
- Track queue depth and in-flight requests per tier.
- Keep utilization below saturation for critical dependencies.
- Add timeouts and circuit breakers around slow downstream calls.
- Prefer fast failure over unbounded waiting when overloaded.
Original DosiBridge notes for Latency vs Throughput vs Bandwidth
This section is written specifically for this page, not copied from a general system-design checklist. The useful way to study Latency vs Throughput vs Bandwidth is to connect the concept to a traffic-management problem where overload behavior matters more than the happy-path diagram. That framing changes the design discussion from definitions to operating choices.
What makes this topic distinct
- SLO: For Latency vs Throughput vs Bandwidth, decide the SLO before choosing tools; otherwise the design looks clean but fails when latency changes.
- Capacity Headroom: For Latency vs Throughput vs Bandwidth, decide the capacity headroom before choosing tools; otherwise the design looks clean but fails when vs changes.
- Failure Mode: For Latency vs Throughput vs Bandwidth, decide the failure mode before choosing tools; otherwise the design looks clean but fails when throughput changes.
- Degradation Path: For Latency vs Throughput vs Bandwidth, decide the degradation path before choosing tools; otherwise the design looks clean but fails when latency changes.
- Operator Signal: For Latency vs Throughput vs Bandwidth, decide the operator signal before choosing tools; otherwise the design looks clean but fails when vs changes.
Production review question
If a team adopts Latency vs Throughput vs Bandwidth, what observable signal proves it helped instead of only making the architecture diagram more fashionable?
Practical metric to track
Track latency-throughput health as a named dashboard or review item: combine one user-facing metric, one saturation metric, and one correctness metric. For Latency vs Throughput vs Bandwidth, this keeps the discussion grounded in behavior that can be measured after deployment instead of generic advice that sounds good in an interview but never gets verified.