Alerting: SLOs, On-Call, Escalation and Noise Reduction
Design effective alerting for distributed systems: SLO-based alerts, thresholds, escalation policies, alert fatigue, runbooks, and incident response.
Quick answer: Alerting: SLOs, On-Call, Escalation and Noise Reduction
Alerting: SLOs, On-Call, Escalation and Noise Reduction is covered here as a practical system design concept. Design effective alerting for distributed systems: SLO-based alerts, thresholds, escalation policies, alert fatigue, runbooks, and incident response. Use it to understand the Distributed Systems idea, where it appears in production systems, and how to discuss it clearly in interviews.
Focus on the problem being solved, the main design choice, the failure mode, and the tradeoff you would defend in front of a senior engineer. This page is part of the DosiBridge system design knowledge graph, so it links related concepts, interview problems, tradeoffs, and references instead of leaving the topic isolated.
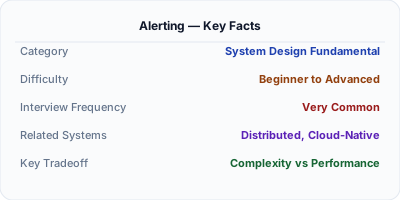
Alerting is the mechanism that notifies engineers when a system requires human attention — turning monitoring data into actionable notifications delivered to the right person at the right time. Effective alerting distinguishes between symptoms (user-facing impact) and causes (internal metrics), prioritizes by severity, and follows escalation paths from the on-call engineer to team leads to incident commanders. Poor alerting creates alert fatigue, where teams ignore pages because most are false alarms or non-actionable. SLO-based alerting and burn-rate calculations represent the modern approach to meaningful, low-noise alerts.
| Aspect | Details |
|---|---|
| What it is | Automated notifications to on-call engineers when system health metrics indicate user-impacting problems requiring human intervention |
| When to use | When monitoring detects conditions that cannot self-heal and require human diagnosis or decision-making to resolve |
| When NOT to use | When the system can auto-remediate (autoscaling, automatic failover) — use automation instead of waking someone at 3 AM |
| Real-world example | PagerDuty routes 15+ billion alert events annually, demonstrating that alerting infrastructure is critical for enterprise operations at scale |
| Interview tip | Discuss alert fatigue and SLO-based burn-rate alerting — interviewers want to see that you know naive threshold alerts are problematic at scale |
| Common mistake | Alerting on symptoms and causes simultaneously — alert on user-facing symptoms (high error rate) and investigate causes, not the reverse |
| Key tradeoff | Sensitivity vs. fatigue — too many alerts cause teams to ignore them, too few mean real incidents go unnoticed for hours |
Why This Matters
Monitoring without alerting is just data collection. Alerts are the bridge between detecting a problem and having a human fix it. But alerting is deceptively hard to get right. Naive threshold alerts — page when error rate exceeds 1% for 5 minutes — generate noise during brief spikes and miss slow degradation. Google's SRE practice introduced burn-rate alerting: calculate how fast your error budget is being consumed and alert when the burn rate predicts budget exhaustion. A 14x burn rate over 1 hour means you will exhaust your monthly budget in 2 days — worth an immediate page. A 2x burn rate over 6 hours means gradual degradation — worth a ticket. This approach reduces noise by 90%+ while catching every real incident. Combined with proper on-call rotations and escalation policies, alerting ensures incidents are handled promptly without burning out engineers.
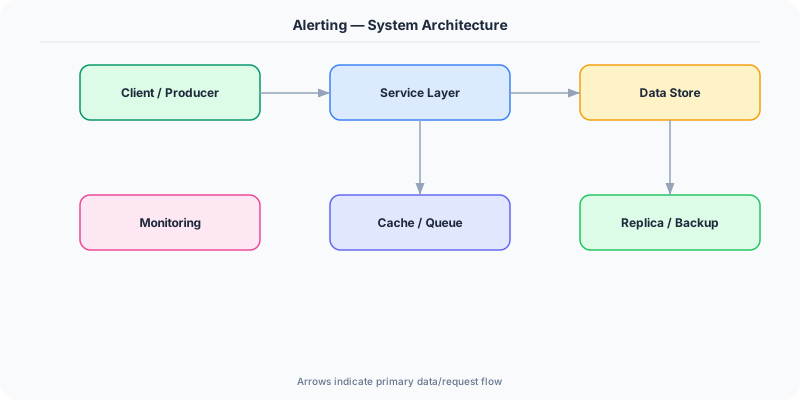
The Building Blocks
- Alert Rules: Conditions defined against metrics that trigger notifications — threshold-based (CPU > 90%), anomaly-based (3 standard deviations), or burn-rate-based (error budget consumption)
- Severity Levels: Classification of alerts by urgency and impact — P1 (page immediately, user-facing outage), P2 (page during business hours), P3 (ticket, address this week)
- On-Call Rotations: Scheduled assignment of engineers responsible for responding to alerts, typically weekly rotations with primary and secondary responders for redundancy
- Escalation Policies: Rules for what happens when an alert is not acknowledged — escalate from primary to secondary on-call, then to team lead, then to engineering manager after defined intervals
- Runbooks: Documented procedures linked to each alert, providing step-by-step diagnosis and remediation instructions so any on-call engineer can handle the incident
Under the Hood
Modern alerting systems operate through a pipeline: metric evaluation, alert routing, notification delivery, and incident management. Prometheus Alertmanager evaluates rules against time-series data, groups related alerts to reduce noise (a cluster of 10 failing pods produces one alert, not 10), and routes alerts through PagerDuty, OpsGenie, or Slack based on severity and team ownership.
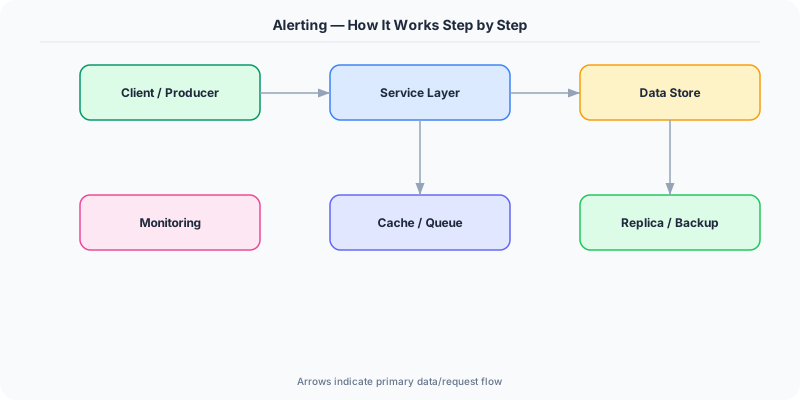
SLO-based alerting represents the most effective approach. Instead of setting arbitrary thresholds on internal metrics, you define alerts based on error budget burn rates. The multi-window approach uses two time windows per severity: for immediate pages, check if the last 1 hour exceeds 14x burn rate AND the last 5 minutes exceeds 14x (to avoid stale alerts). For ticket-based alerts, check if the last 6 hours exceed 6x burn rate AND the last 30 minutes exceeds 6x. This dual-window approach catches both sudden outages and gradual degradation while virtually eliminating false positives.
Alert fatigue management is an ongoing operational practice. Teams should track alert-to-incident ratios: if fewer than 50% of pages result in an actual incident requiring action, the alerts need tuning. Regular alert review meetings examine each alert that fired, classify it as true positive, false positive, or not actionable, and refine thresholds accordingly. The goal is that every page wakes an engineer for a genuine, user-impacting problem that requires human judgment to resolve.
How Companies Actually Do This
PagerDuty Processes billions of alert events and provides intelligent noise reduction, grouping related alerts and using ML to predict incident severity, used by over 20,000 organizations
Google Pioneered SLO-based alerting and error budget burn rates in their SRE practice, reducing false-positive pages by over 90% compared to traditional threshold-based alerting
Atlassian Built Opsgenie for alert management with on-call scheduling, escalation policies, and integration with Jira for incident tracking across engineering organizations
Common Pitfalls
- Alerting on causes instead of symptoms — alerting when CPU exceeds 80% is less useful than alerting when request error rate exceeds the SLO because users do not experience CPU, they experience errors
- Not having runbooks for every alert — on-call engineers get paged at 3 AM for an alert with no documentation, wasting time figuring out what the alert means and how to remediate
- Creating too many P1 alerts so everything pages immediately — when everything is urgent, nothing is; reserve P1 for user-facing outages and use P2/P3 for degradation
Interview Questions Worth Practicing
- How does SLO-based burn-rate alerting reduce alert fatigue compared to simple threshold alerts?
- How would you design an on-call rotation and escalation policy for a team of six engineers?
- What is the difference between alerting on symptoms versus causes, and why does it matter?
The Tradeoffs
- Sensitivity vs. Fatigue: Lower thresholds catch more issues but generate more false positives that train engineers to ignore pages
- Speed vs. Confidence: Shorter evaluation windows detect issues faster but are more prone to transient spike false alarms
- Automation vs. Human Judgment: Auto-remediation handles known issues faster but novel incidents require human diagnosis and creative problem-solving
How to Explain This in an Interview
Here is how I would explain Alerting in a system design interview:
Alerting notifies engineers when systems need human attention. I follow Google SRE principles: alert on user-facing symptoms (error rate, latency) not internal causes (CPU, memory). I use multi-window burn-rate alerting — if the error budget is being consumed at 14x the sustainable rate over the last hour, that is an immediate page; at 2x over 6 hours, that is a ticket. This eliminates most false positives. Every alert needs a severity level (P1 pages immediately, P2 pages business hours, P3 creates a ticket), a clear runbook, and an owning team. On-call rotations should have primary and secondary responders with escalation policies. I track alert-to-incident ratios — if less than half of pages lead to real incidents, alerts need tuning.
Related Topics
Original DosiBridge notes for Alerting: SLOs, On-Call, Escalation and Noise Reduction
This section is written specifically for this page, not copied from a general system-design checklist. The useful way to study Alerting: SLOs, On-Call, Escalation and Noise Reduction is to connect the concept to a production service where growth exposes the first weak assumption in the original design. That framing changes the design discussion from definitions to operating choices.
What makes this topic distinct
- Membership: For Alerting: SLOs, On-Call, Escalation and Noise Reduction, decide the membership before choosing tools; otherwise the design looks clean but fails when alerting changes.
- Clock Drift: For Alerting: SLOs, On-Call, Escalation and Noise Reduction, decide the clock drift before choosing tools; otherwise the design looks clean but fails when alerting changes.
- Retry Semantics: For Alerting: SLOs, On-Call, Escalation and Noise Reduction, decide the retry semantics before choosing tools; otherwise the design looks clean but fails when alerting changes.
- Partition Behavior: For Alerting: SLOs, On-Call, Escalation and Noise Reduction, decide the partition behavior before choosing tools; otherwise the design looks clean but fails when alerting changes.
- Reconciliation: For Alerting: SLOs, On-Call, Escalation and Noise Reduction, decide the reconciliation before choosing tools; otherwise the design looks clean but fails when alerting changes.
Production review question
If a team adopts Alerting: SLOs, On-Call, Escalation and Noise Reduction, what observable signal proves it helped instead of only making the architecture diagram more fashionable?
Practical metric to track
Track alerting health as a named dashboard or review item: combine one user-facing metric, one saturation metric, and one correctness metric. For Alerting: SLOs, On-Call, Escalation and Noise Reduction, this keeps the discussion grounded in behavior that can be measured after deployment instead of generic advice that sounds good in an interview but never gets verified.