Canary Release
Canary release gradually rolls out a new version to a small percentage of users first, monitoring for issues before expanding to 100%, reducing the blast.
Quick answer: Canary Release
Canary Release is covered here as a practical system design concept. Canary release gradually rolls out a new version to a small percentage of users first, monitoring for issues before expanding to 100%, reducing the blast. Use it to understand the Architecture Patterns idea, where it appears in production systems, and how to discuss it clearly in interviews.
Focus on the problem being solved, the main design choice, the failure mode, and the tradeoff you would defend in front of a senior engineer. This page is part of the DosiBridge system design knowledge graph, so it links related concepts, interview problems, tradeoffs, and references instead of leaving the topic isolated.
Canary release deploys a new version to a small percentage of users (1-5%) while the majority stays on the current version. If metrics look healthy — error rate, latency, business KPIs — the rollout gradually expands: 5%, 25%, 50%, 100%. If anything degrades, the canary is killed and all traffic returns to the stable version. Named after coal mine canaries that detected danger before miners, this pattern minimizes the blast radius of bad deployments.
| Aspect | Details |
|---|---|
| What it is | A progressive deployment strategy that routes a small percentage of traffic to the new version, expanding gradually based on health metrics |
| When to use | User-facing deployments where bad releases could impact millions of users — web apps, mobile backends, API services |
| When NOT to use | Infrastructure changes where partial deployment does not make sense, or when the change is too small to justify gradual rollout |
| Real-world example | Google deploys all production changes via canary — 0.1% of traffic first, monitored for 30 minutes, then expanding in stages over hours |
| Interview tip | Describe the automated metrics that trigger rollback: error rate, P99 latency, conversion rate — not just 'we watch dashboards' |
| Common mistake | Using canary without automated rollback criteria — manual monitoring at 3 AM leads to slow detection and human error |
| Key tradeoff | Safety of gradual rollout vs speed of full deployment and complexity of traffic splitting infrastructure |
Why This Matters
A bad deployment to 100% of users causes a full outage. A bad deployment to 1% of users is a minor incident. Canary releases reduce the blast radius from full outage to small degradation. Google, Facebook, and Netflix all use automated canary analysis to gate every production deployment. The system compares canary metrics (error rate, latency, CPU usage) against the baseline and automatically promotes or kills the canary. This eliminates the human judgment bottleneck and catches issues that only manifest under real production traffic.
The Building Blocks
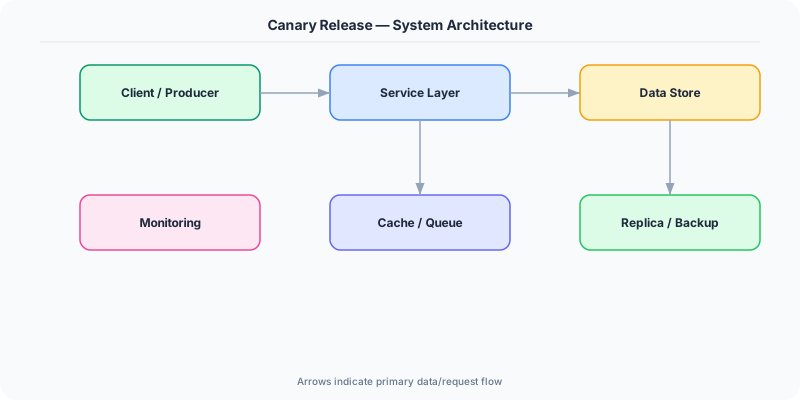
- Traffic Splitting: The load balancer or service mesh routes a configurable percentage of traffic to the canary. Weighted routing rules direct 1% to the new version and 99% to the current.
- Canary Analysis: Automated comparison of canary metrics vs baseline. If the canary's error rate is >1.5x the baseline, the rollout is halted and rolled back automatically.
- Progressive Rollout: A multi-step promotion schedule: 1% → 5% → 25% → 50% → 100%. Each step requires passing the analysis criteria for a specified duration (e.g., 10 minutes per step).
- Metric Collection: Real-time metrics from both canary and baseline instances: HTTP error rates, P50/P99 latency, CPU/memory usage, business KPIs (conversion rate, click-through).
- Automated Rollback: If canary analysis detects degradation, the system automatically routes 100% of traffic back to the stable version without human intervention.
Under the Hood
The rollout starts by deploying the new version to a small instance pool (the canary). The load balancer (or service mesh like Istio) is configured to send 1% of traffic to the canary pool and 99% to the baseline. Both pools report metrics to the same monitoring system.
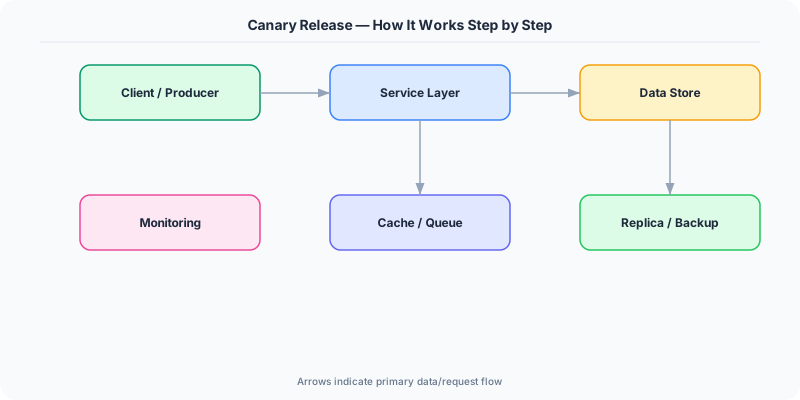
The canary analysis engine compares metrics over a time window (typically 10-30 minutes per stage). For each metric (error rate, P99 latency, success rate), it tests whether the canary is statistically worse than the baseline. A common approach uses Mann-Whitney U-test: if the canary's latency distribution is significantly higher than the baseline's, the canary fails. Netflix's Kayenta uses this approach to eliminate false positives from normal variance.
If the canary passes all criteria, the system promotes to the next stage: 5% traffic. The process repeats at each stage. If any stage fails, traffic is immediately routed 100% to the baseline, and the canary instances are terminated. The entire rollout — from 1% to 100% — typically takes 1-4 hours for critical services, ensuring thorough validation at each stage.
How Companies Actually Do This
Google uses automated canary analysis for all production deployments. Their Canarying tool tests 0.1% of traffic for 30 minutes with statistical analysis before allowing promotion to wider rollout.
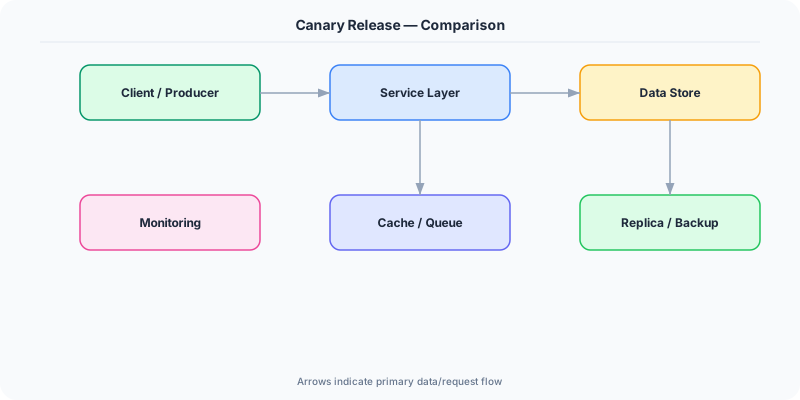
Netflix built Kayenta, an open-source automated canary analysis tool. It compares canary metrics against baseline using statistical tests and automatically approves or rejects the deployment.
Facebook uses their Gatekeeper system for progressive rollout. New features start at 0.1% of users (a single data center), expand region by region, and reach 100% over days.
Common Pitfalls
- Setting the canary percentage too high initially — if 20% of traffic hits a buggy canary, that is a significant incident, not a canary test
- Comparing canary metrics against itself instead of the baseline — you need a control group (baseline) to detect relative degradation, not absolute thresholds
- Not including business metrics in canary analysis — the canary might have normal error rates but a 10% drop in conversion rate that technical metrics miss
Interview Questions Worth Practicing
- How would you set up automated canary analysis for a microservice deployment?
- What metrics would you include in canary analysis beyond error rates?
- How do you handle canary deployments for stateful services or database migrations?
The Tradeoffs
- Safety vs Speed: Gradual rollout with analysis at each stage catches issues early, but a full deployment takes hours instead of minutes.
- Blast Radius vs Confidence: Small canary percentages (1%) limit blast radius but may not surface issues that only appear at higher traffic volumes (race conditions, cache effects).
- Automated vs Manual: Automated canary analysis removes human judgment (faster, more consistent) but may miss subtle issues that require human interpretation (UX regressions, data quality).
How to Explain This in an Interview
Here is how I would explain Canary Release in a system design interview:
Canary release deploys a new version to a small percentage of users first, expanding gradually based on health metrics. I start with 1% of traffic to the canary, compare its error rate and P99 latency against the baseline using statistical analysis, and if healthy, promote to 5%, 25%, 50%, 100%. Each stage has a 15-minute evaluation window. If the canary's error rate is 1.5x worse than baseline, automated rollback kicks in immediately. This limits blast radius: a bad deployment affects 1% of users for 15 minutes instead of 100% of users for however long it takes a human to notice. I include business metrics too — conversion rate, not just error rate — because a silently broken feature has healthy error rates but destroys revenue.
Related Topics
Original DosiBridge notes for Canary Release
This section is written specifically for this page, not copied from a general system-design checklist. The useful way to study Canary Release is to connect the concept to a production service where growth exposes the first weak assumption in the original design. That framing changes the design discussion from definitions to operating choices.
What makes this topic distinct
- Ownership Boundary: For Canary Release, decide the ownership boundary before choosing tools; otherwise the design looks clean but fails when canary changes.
- Blast Radius: For Canary Release, decide the blast radius before choosing tools; otherwise the design looks clean but fails when release changes.
- Deployment Path: For Canary Release, decide the deployment path before choosing tools; otherwise the design looks clean but fails when canary changes.
- Runtime Coupling: For Canary Release, decide the runtime coupling before choosing tools; otherwise the design looks clean but fails when release changes.
- Operational Handoff: For Canary Release, decide the operational handoff before choosing tools; otherwise the design looks clean but fails when canary changes.
Production review question
If a team adopts Canary Release, what observable signal proves it helped instead of only making the architecture diagram more fashionable?
Practical metric to track
Track canary-release health as a named dashboard or review item: combine one user-facing metric, one saturation metric, and one correctness metric. For Canary Release, this keeps the discussion grounded in behavior that can be measured after deployment instead of generic advice that sounds good in an interview but never gets verified.