How Uber Handles Millions of Concurrent Rides
Quick answer: How Uber Handles Millions of Concurrent Rides
How Uber Handles Millions of Concurrent Rides is covered here as a practical system design article. Inside Uber's architecture — geospatial indexing, real-time dispatch, surge pricing, and how they match riders with drivers across 70 countries. Use it to turn a broad system design idea into an interview-ready checklist with practical examples and links to deeper topics.
Focus on the problem being solved, the main design choice, the failure mode, and the tradeoff you would defend in front of a senior engineer. This page is part of the DosiBridge system design knowledge graph, so it links related concepts, interview problems, tradeoffs, and references instead of leaving the topic isolated.
How Uber Handles Millions of Concurrent Rides
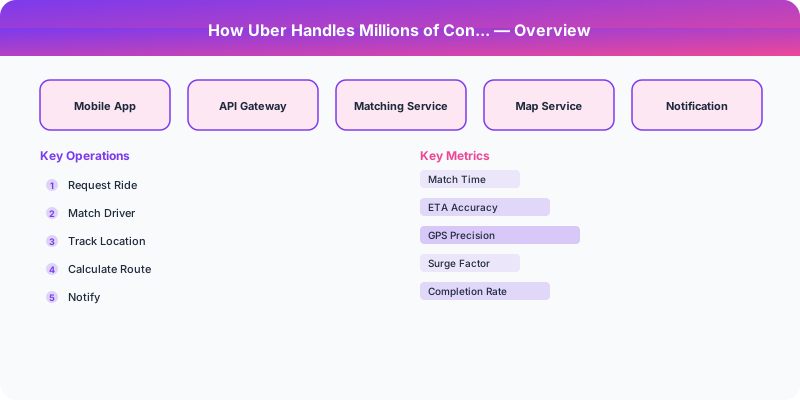
Uber processes over 20 million rides per day across 70 countries. At peak (New Year's Eve), they handle 1M+ concurrent rides simultaneously. This requires real-time geospatial processing, intelligent dispatch, and dynamic pricing — all with sub-second latency.
Core Technical Challenges
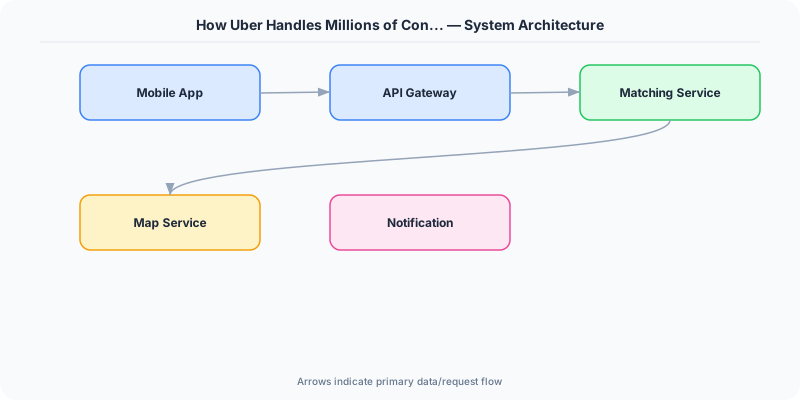
1. Geospatial Indexing: Where Are the Drivers?
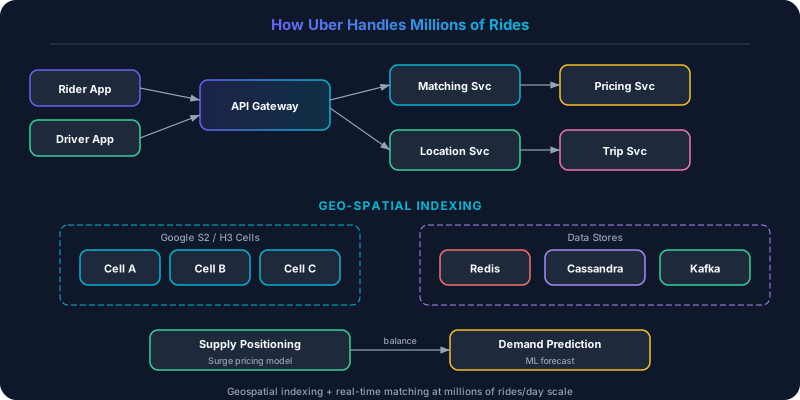
5 million active drivers send GPS updates every 4 seconds. That is 1.25 million location updates per second. Uber needs to answer: "Which available drivers are within 5 minutes of this rider?"
Solution: Google S2 Geometry Library
Uber divides the Earth's surface into hierarchical cells using S2 (a spherical geometry library). Each cell has a unique 64-bit ID. Driver locations are indexed by their S2 cell ID.
Finding nearby drivers:
- Compute the S2 cell covering the rider's location
- Expand to neighboring cells (radius search)
- Look up drivers in those cells from an in-memory index
- Filter by availability, vehicle type, ETA
This is O(1) for cell lookup + O(K) for filtering K candidate drivers.
2. Dispatch: Matching Riders with Drivers
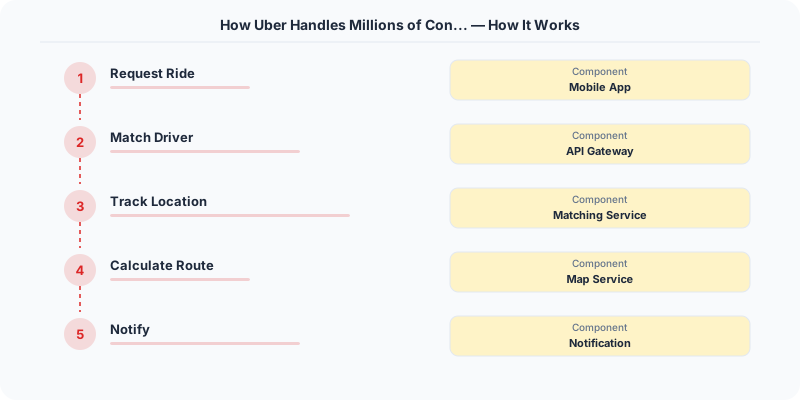
When a rider requests a ride, the dispatch system must find the optimal driver within seconds.
Algorithm:
- Query geospatial index for available drivers within radius
- Compute ETA from each driver to the rider (using road network graph, not straight-line distance)
- Score each driver: ETA + driver rating + supply/demand balance
- Send ride offer to the top-scored driver
- If driver declines (15-second timeout), offer to the next driver
At scale, Uber batches dispatch: every 2 seconds, the system considers ALL pending ride requests and ALL available drivers in a city, computing a globally optimal matching. This is better than greedy one-at-a-time matching because it can avoid sending a far driver to a near rider when a closer driver is about to become available.
3. Surge Pricing: Balancing Supply and Demand
When demand exceeds supply in a zone, Uber increases prices. This serves two purposes:
- Demand reduction: Some riders defer their trip
- Supply increase: Drivers are incentivized to drive to the surge zone
How it works:
- Each city is divided into hexagonal zones
- Every 1-2 minutes, compute: surge_multiplier = demand_requests / available_drivers per zone
- If ratio > 1.5x, apply surge. Multipliers range from 1.2x to 5x+
- Surge is displayed to the rider before they confirm
4. Reliable Payment Processing
Every ride involves a payment. Uber must guarantee:
- No double-charging (idempotency)
- No lost charges (durability)
- Correct fare calculation (distance + time + surge)
Uber uses a double-entry ledger system with idempotency keys. Each payment attempt has a unique ID. If the first attempt is ambiguous (timeout), the retry with the same ID returns the original result.
Key Takeaways
- S2 Geometry for geospatial: Hierarchical cell indexing is more efficient than naive distance calculations
- Batch dispatch outperforms greedy: Considering all requests and drivers together produces better matches
- Surge pricing is a market mechanism: It solves the supply/demand imbalance algorithmically
- Idempotency everywhere: Financial operations must be safely retryable
Original DosiBridge notes for How Uber Handles Millions of Concurrent Rides
This section is written specifically for this page, not copied from a general system-design checklist. The useful way to study How Uber Handles Millions of Concurrent Rides is to connect the concept to a production service where growth exposes the first weak assumption in the original design. That framing changes the design discussion from definitions to operating choices.
What makes this topic distinct
- Practical Lesson: For How Uber Handles Millions of Concurrent Rides, decide the practical lesson before choosing tools; otherwise the design looks clean but fails when how changes.
- Migration Story: For How Uber Handles Millions of Concurrent Rides, decide the migration story before choosing tools; otherwise the design looks clean but fails when uber changes.
- Production Symptom: For How Uber Handles Millions of Concurrent Rides, decide the production symptom before choosing tools; otherwise the design looks clean but fails when handles changes.
- Decision Checklist: For How Uber Handles Millions of Concurrent Rides, decide the decision checklist before choosing tools; otherwise the design looks clean but fails when millions changes.
- Rollback Plan: For How Uber Handles Millions of Concurrent Rides, decide the rollback plan before choosing tools; otherwise the design looks clean but fails when of changes.
Production review question
If a team adopts How Uber Handles Millions of Concurrent Rides, what observable signal proves it helped instead of only making the architecture diagram more fashionable?
Practical metric to track
Track how-rides health as a named dashboard or review item: combine one user-facing metric, one saturation metric, and one correctness metric. For How Uber Handles Millions of Concurrent Rides, this keeps the discussion grounded in behavior that can be measured after deployment instead of generic advice that sounds good in an interview but never gets verified.
Sources
- Uber Engineering Blog: eng.uber.com
- System-Design-Overview
Putting This Into Practice
Understanding the theory is only half the battle. Here is how to apply these concepts in your daily work:
Start small. Pick one project or one component of your current system and apply the ideas from this article. Do not try to redesign everything at once.
Document your decisions. When you make an architectural choice, write a short ADR (Architecture Decision Record) explaining what you chose, why, and what alternatives you considered. Future you will thank present you.
Talk to your team. System design is a team sport. Share what you learn, discuss tradeoffs openly, and build shared understanding. The best architectures come from teams that communicate well, not from lone geniuses.
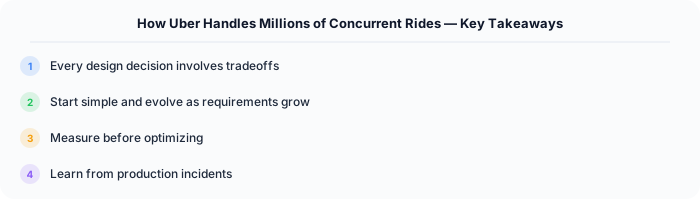
Key Takeaways
- Every design decision involves tradeoffs — there is no perfect solution
- Start simple and evolve as requirements grow
- Measure before optimizing — premature optimization wastes engineering time
- Learn from production incidents — they teach you more than any textbook
- Practice explaining your reasoning — this is what interviews test
The ETA Prediction Challenge

Predicting how long a ride will take sounds simple: distance divided by speed. But in practice, ETA prediction is one of Uber's hardest engineering problems. Traffic conditions change minute by minute. Construction zones, accidents, and weather all affect actual travel time. Rush hour patterns differ by city, day of week, and even holiday schedules.
Uber's ETA model uses a combination of historical GPS traces (millions of past trips on every road segment), real-time GPS data from active drivers (updated every 4 seconds), and external signals like traffic incidents and weather. The model predicts travel time for each road segment independently, then sums them along the optimal route.
Accuracy matters enormously: if the ETA is too short, riders get frustrated waiting. If too long, they might choose a competitor. Uber targets within 2 minutes of actual time for 90 percent of rides.
Payment at Scale
Every ride involves charging the rider and paying the driver — millions of financial transactions per day that must be exactly correct. Uber uses an idempotency-key system similar to Stripe: each payment attempt has a unique ID, and retrying with the same ID returns the original result without double-charging.
The fare itself is calculated from GPS data: the actual distance traveled and time elapsed, multiplied by per-mile and per-minute rates, plus any surge multiplier. Uber records the complete GPS trail of every ride for fare disputes and auditing.
Settlement with drivers happens weekly. Uber nets out the platform fee (typically 20-25 percent), deducts expenses, and transfers the balance to the driver's bank account. This settlement system processes payments in 70 or more countries with different banking systems, currencies, and tax requirements.