Design an Analytics Platform
Design an analytics platform with event ingestion, real-time aggregation, dashboards, and ad-hoc queries. Covers Lambda architecture and columnar storage.
Quick answer: Design an Analytics Platform
Design an Analytics Platform is covered here as a practical system design interview problem. Design an analytics platform with event ingestion, real-time aggregation, dashboards, and ad-hoc queries. Covers Lambda architecture and columnar storage. Use it to practice requirements, APIs, storage choices, scaling bottlenecks, data consistency, observability, and failure handling for a medium interview round.
Focus on the problem being solved, the main design choice, the failure mode, and the tradeoff you would defend in front of a senior engineer. This page is part of the DosiBridge system design knowledge graph, so it links related concepts, interview problems, tradeoffs, and references instead of leaving the topic isolated.
Problem Statement
Design an analytics platform (like Google Analytics or Amplitude) that ingests billions of events per day from web/mobile apps, processes them in real time for live dashboards, stores them for historical ad-hoc queries, and supports custom metrics, funnels, and cohort analysis. Must handle bursty ingestion and provide query results in seconds.
Requirements
Functional
- Ingest events (page_view, click, purchase, custom) with arbitrary properties via a lightweight SDK
- Real-time dashboards showing active users, event counts, and conversion rates updated every 5 seconds
- Ad-hoc queries: filter/group events by any property, time range, and user segments
- Funnel analysis: define multi-step funnels and compute conversion rates
Non-Functional
- Ingestion: 10B events/day, peak 500K events/second, <1 second end-to-end to dashboard
- Query latency: Real-time dashboards <2 seconds, ad-hoc queries <10 seconds for 90-day range
- Retention: Raw events stored for 2 years, aggregates forever
- Scale: 100K customer apps, each sending millions of events/day
Core Architecture
-
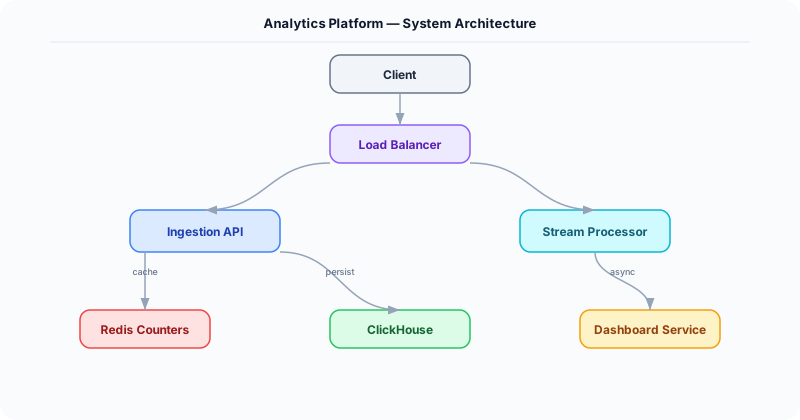
Event Ingestion Gateway -- Lightweight HTTP endpoint that accepts event batches from client SDKs. Validates schema, enriches with server timestamp and geo-IP, and publishes to Kafka. The gateway is stateless and horizontally scaled behind a load balancer. Client SDKs batch events locally (every 10 seconds or 20 events) to reduce HTTP overhead.
-
Stream Processing Layer (Flink) -- Consumes events from Kafka in real time. Computes pre-aggregated metrics: event counts, unique users (HyperLogLog), and active session counts per 5-second window per customer app. Outputs aggregates to Redis for live dashboards and to the raw event store for historical queries.
-
Columnar Event Store (ClickHouse) -- Stores raw events in a columnar format partitioned by date and customer_id. Columnar storage enables fast aggregation queries (scanning only relevant columns). Compression ratios of 10-20x reduce storage costs. Supports SQL-like queries with sub-second response for most analytical patterns.
- Query Engine -- Translates user-defined dashboards and ad-hoc queries into optimized SQL against ClickHouse. For funnel analysis, uses window functions to detect sequential event patterns per user. For real-time metrics, reads pre-aggregated data from Redis. Caches frequently-run dashboard queries with a 5-second TTL.
Database Choice
ClickHouse for raw event storage and ad-hoc queries -- columnar format ideal for analytical workloads, handles 10B rows/day insertion with excellent compression. Redis for real-time pre-aggregated metrics (counters, HyperLogLog sketches for unique users, sorted sets for top events). Kafka as the event bus between ingestion and processing. PostgreSQL for customer accounts, dashboard definitions, and funnel configurations.
Key API Endpoints
POST /api/v1/events/batch
  -> Body: \{ app_id: "APP-1", events: [\{ name: "page_view", properties: \{ url: "/home" \}, user_id: "U1", timestamp: ... \}] \}

GET /api/v1/analytics/\{app_id\}/query
  -> Body: \{ metric: "unique_users", filters: [\{ property: "country", op: "eq", value: "US" \}], group_by: "device_type", range: "7d" \}
  -> Returns: \{ results: [\{ device_type: "mobile", unique_users: 142000 \}, ...], query_time_ms: 850 \}

POST /api/v1/analytics/\{app_id\}/funnel
  -> Body: \{ steps: ["page_view", "add_to_cart", "purchase"], range: "30d" \}
  -> Returns: \{ funnel: [\{ step: "page_view", users: 100000 \}, \{ step: "add_to_cart", users: 25000, conversion: 0.25 \}, \{ step: "purchase", users: 5000, conversion: 0.20 \}] \}
Scaling Insight
Pre-aggregation at the stream processing layer is the secret to real-time dashboards at scale. Instead of querying 10B raw events for a simple "active users in the last hour" metric, Flink maintains a rolling HyperLogLog sketch per customer app per 5-second window. The dashboard reads these pre-computed sketches from Redis, merging windows as needed. This turns a billion-row scan into a sub-millisecond Redis read, making real-time dashboards feasible regardless of event volume.
Key Tradeoffs
| Decision | Option A | Option B | Chosen |
|---|---|---|---|
| Event store | Row-oriented (PostgreSQL) | Columnar (ClickHouse) | Columnar -- 10-100x faster for analytical aggregation queries, 10x better compression |
| Real-time metrics | Query raw events on every dashboard load | Pre-aggregate in stream processor | Pre-aggregate -- O(1) dashboard reads instead of scanning billions of rows |
| Ingestion | Synchronous write to database | Kafka buffer + async write | Kafka buffer -- absorbs traffic spikes, decouples ingestion from storage speed |
Original DosiBridge notes for Design an Analytics Platform
This section is written specifically for this page, not copied from a general system-design checklist. The useful way to study Design an Analytics Platform is to connect the concept to a production service where growth exposes the first weak assumption in the original design. That framing changes the design discussion from definitions to operating choices.
What makes this topic distinct
- Core Entity: For Design an Analytics Platform, decide the core entity before choosing tools; otherwise the design looks clean but fails when analytics changes.
- Read/Write Path: For Design an Analytics Platform, decide the read/write path before choosing tools; otherwise the design looks clean but fails when platform changes.
- Contention Point: For Design an Analytics Platform, decide the contention point before choosing tools; otherwise the design looks clean but fails when analytics changes.
- Abuse Path: For Design an Analytics Platform, decide the abuse path before choosing tools; otherwise the design looks clean but fails when platform changes.
- Recovery Workflow: For Design an Analytics Platform, decide the recovery workflow before choosing tools; otherwise the design looks clean but fails when analytics changes.
Design an Analytics Platform correctness boundary
For this problem, separate the user-visible action from background work. The correctness boundary is the smallest state transition that must not be duplicated, lost, or reordered. Naming that boundary makes the solution more original than a stock API/database/cache template.
Design an Analytics Platform scaling bottleneck
The first bottleneck should be described in the language of this system: a hot timeline, a contested seat, a busy wallet ledger, a media-processing queue, or a search index update delay. That bottleneck decides which component deserves the deepest interview discussion.
Production review question
If Design an Analytics Platform suddenly receives 10x traffic, which entity becomes contested first, and what queue, lock, shard, or cache protects that entity without hiding correctness bugs?
Practical metric to track
Track analytics-platform health as a named dashboard or review item: combine one user-facing metric, one saturation metric, and one correctness metric. For Design an Analytics Platform, this keeps the discussion grounded in behavior that can be measured after deployment instead of generic advice that sounds good in an interview but never gets verified.