Design Google Maps
Design Google Maps with graph routing (Dijkstra/A*), tile rendering, real-time traffic, geocoding, and turn-by-turn navigation.
Quick answer: Design Google Maps
Design Google Maps is covered here as a practical system design interview problem. Design Google Maps with graph routing (Dijkstra/A*), tile rendering, real-time traffic, geocoding, and turn-by-turn navigation. Use it to practice requirements, APIs, storage choices, scaling bottlenecks, data consistency, observability, and failure handling for a hard interview round.
Focus on the problem being solved, the main design choice, the failure mode, and the tradeoff you would defend in front of a senior engineer. This page is part of the DosiBridge system design knowledge graph, so it links related concepts, interview problems, tradeoffs, and references instead of leaving the topic isolated.
Problem Statement
Design a mapping and navigation platform like Google Maps. Users view maps at various zoom levels, search for places, get driving/walking/transit directions with turn-by-turn navigation, and see real-time traffic conditions. The system must compute optimal routes across a road graph with billions of edges and render map tiles for the entire planet.
Requirements
Functional
- Render map tiles at 20+ zoom levels for the entire world (vector or raster tiles)
- Geocoding: convert addresses to coordinates and vice versa
- Route calculation: optimal path between two points considering distance, time, and traffic
- Real-time traffic overlay: color-code roads by congestion level
Non-Functional
- Latency: Map tiles load in <200ms, route calculation in <1 second for 99% of queries
- Scale: 1B MAU, 10M route requests/hour, 100B+ road segments globally
- Freshness: Traffic data updated every 1-2 minutes
- Storage: Petabytes of map data, satellite imagery, and street-level photos
Core Architecture
-
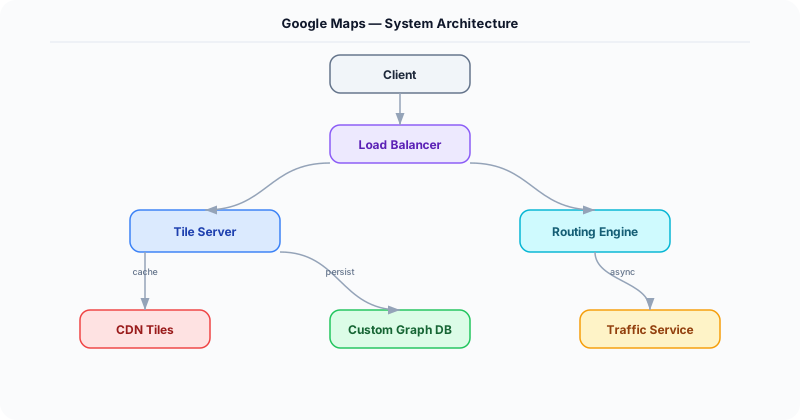
Tile Server -- Pre-renders the world map as a pyramid of tiles at each zoom level. At zoom 0: 1 tile covers the earth. At zoom 18: 68B tiles at ~1m resolution. Vector tiles (Mapbox Vector Tile format) are preferred over raster: 10x smaller, style-able client-side, and resolution-independent. Tiles are stored in object storage and served via CDN with long cache TTLs (map data changes slowly).
-
Routing Engine -- Models the road network as a weighted directed graph (intersections = nodes, road segments = edges, weight = travel time). Uses Contraction Hierarchies for fast shortest-path queries: a preprocessing step creates shortcut edges between important nodes, reducing the runtime query to ~1ms (vs. seconds for raw Dijkstra on a billion-edge graph). Traffic-aware routing adjusts edge weights using real-time traffic data.
-
Geocoding Service -- Maps address strings to coordinates (and reverse). Uses an address parser + a spatial index of addresses. Forward geocoding: parse "123 Main St, SF" into structured components, look up in address database. Reverse geocoding: find the nearest address point to a coordinate. Backed by Elasticsearch with geo_point fields.
-
Traffic Data Pipeline -- Aggregates speed data from millions of GPS-enabled devices (phones, connected cars). Each device reports (lat, lng, speed, heading) every 30 seconds. A Flink streaming job maps each report to a road segment (map matching), computes average speed per segment per minute, and classifies congestion: green (>80% of speed limit), yellow (40-80%), red (<40%).
-
Navigation Service -- Provides turn-by-turn directions based on the computed route. Monitors the user's real-time location and detects deviation from the route (>50m off-path triggers re-routing). Pushes updated ETAs as traffic changes en route.
Database Choice
Object storage (S3/GCS) for pre-rendered map tiles (petabytes). Custom graph storage (adjacency list in memory-mapped files) for the road network -- the entire US road graph (~100M nodes, 200M edges) fits in ~40 GB of RAM. Elasticsearch for geocoding (address search). Redis for real-time traffic segment speeds (1M road segments * 8 bytes speed = 8 MB, trivially fits in memory). Cassandra for historical traffic data and GPS traces.
Key API Endpoints
GET /api/v1/tiles/\{z\}/\{x\}/\{y\}.mvt
  -> Returns: Vector tile (protocol buffer format) for zoom level z, tile coordinates (x, y)

GET /api/v1/route?origin=37.77,-122.42&dest=37.33,-121.89&mode=driving&traffic=true
  -> Returns: \{ route: \{ distance_km: 78, duration_min: 55, polyline: "encoded...", steps: [\{ instruction: "Turn right on I-280 S", distance_m: 5200 \}] \}, traffic_delay_min: 8 \}

GET /api/v1/geocode?address=1600+Amphitheatre+Pkwy
  -> Returns: \{ results: [\{ formatted: "1600 Amphitheatre Parkway, Mountain View, CA", lat: 37.4221, lng: -122.0841 \}] \}
Scaling Insight
Contraction Hierarchies is the algorithm that makes real-time routing possible at scale. Raw Dijkstra on a graph with 100M+ nodes takes seconds per query. Contraction Hierarchies preprocesses the graph offline (takes hours, runs weekly): iteratively removes less-important nodes and adds shortcut edges preserving shortest-path distances. The result is a query that examines only ~1000 nodes instead of millions, answering shortest-path queries in <1ms. Traffic-aware queries use a modified version that re-weights shortcut edges based on current traffic.
Key Tradeoffs
| Decision | Option A | Option B | Chosen |
|---|---|---|---|
| Tile format | Raster (PNG) | Vector (MVT/PBF) | Vector -- 10x smaller, styleable client-side, sharper at all zoom levels |
| Routing algorithm | Dijkstra/A* (simple) | Contraction Hierarchies (preprocessed) | CH -- 1000x faster queries, worth the preprocessing cost for web-scale service |
| Traffic data source | Fixed road sensors | Crowd-sourced GPS | Crowd-sourced -- covers far more roads, real-time, no infrastructure cost per sensor |
Original DosiBridge notes for Design Google Maps
This section is written specifically for this page, not copied from a general system-design checklist. The useful way to study Design Google Maps is to connect the concept to a production service where growth exposes the first weak assumption in the original design. That framing changes the design discussion from definitions to operating choices.
What makes this topic distinct
- Core Entity: For Design Google Maps, decide the core entity before choosing tools; otherwise the design looks clean but fails when google changes.
- Read/Write Path: For Design Google Maps, decide the read/write path before choosing tools; otherwise the design looks clean but fails when maps changes.
- Contention Point: For Design Google Maps, decide the contention point before choosing tools; otherwise the design looks clean but fails when google changes.
- Abuse Path: For Design Google Maps, decide the abuse path before choosing tools; otherwise the design looks clean but fails when maps changes.
- Recovery Workflow: For Design Google Maps, decide the recovery workflow before choosing tools; otherwise the design looks clean but fails when google changes.
Design Google Maps correctness boundary
For this problem, separate the user-visible action from background work. The correctness boundary is the smallest state transition that must not be duplicated, lost, or reordered. Naming that boundary makes the solution more original than a stock API/database/cache template.
Design Google Maps scaling bottleneck
The first bottleneck should be described in the language of this system: a hot timeline, a contested seat, a busy wallet ledger, a media-processing queue, or a search index update delay. That bottleneck decides which component deserves the deepest interview discussion.
Production review question
If Design Google Maps suddenly receives 10x traffic, which entity becomes contested first, and what queue, lock, shard, or cache protects that entity without hiding correctness bugs?
Practical metric to track
Track google-maps health as a named dashboard or review item: combine one user-facing metric, one saturation metric, and one correctness metric. For Design Google Maps, this keeps the discussion grounded in behavior that can be measured after deployment instead of generic advice that sounds good in an interview but never gets verified.