Time Series Databases: Metrics, Retention and High-Write Storage
Learn time series database design: timestamped writes, retention policies, downsampling, compression, Prometheus, InfluxDB, and query tradeoffs.
Quick answer: Time Series Databases: Metrics, Retention and High-Write Storage
Time Series Databases: Metrics, Retention and High-Write Storage is covered here as a practical system design concept. Learn time series database design: timestamped writes, retention policies, downsampling, compression, Prometheus, InfluxDB, and query tradeoffs. Use it to understand the Databases idea, where it appears in production systems, and how to discuss it clearly in interviews.
Focus on the problem being solved, the main design choice, the failure mode, and the tradeoff you would defend in front of a senior engineer. This page is part of the DosiBridge system design knowledge graph, so it links related concepts, interview problems, tradeoffs, and references instead of leaving the topic isolated.
Time series databases (TSDBs) are optimized for data where each record has a timestamp and values change over time — metrics, sensor readings, stock prices, and application telemetry. Unlike general-purpose databases, TSDBs are designed for extremely high write throughput, efficient time-range queries, built-in downsampling, and automatic data retention policies. Systems like InfluxDB, Prometheus, TimescaleDB, and QuestDB power monitoring, IoT analytics, and financial data platforms by handling millions of data points per second with specialized storage engines.
| Aspect | Details |
|---|---|
| What it is | A database optimized for time-stamped data with high write throughput, efficient range queries, and built-in aggregation, downsampling, and retention policies |
| When to use | Monitoring and observability (metrics, logs, traces), IoT sensor data, financial market data, resource utilization tracking, and any workload dominated by time-ordered writes and range reads |
| When NOT to use | General-purpose CRUD applications, transactional data requiring ACID, or workloads with frequent random updates to historical data |
| Real-world example | Prometheus is the standard TSDB for Kubernetes monitoring, scraping metrics from thousands of containers every 15 seconds and enabling alerting and dashboarding via Grafana |
| Interview tip | Emphasize that time series data is append-mostly (rarely updated), read patterns are time-range scans (not point lookups), and old data can be downsampled — these three properties drive every TSDB optimization |
| Common mistake | Using a relational database for high-volume time series data without TimescaleDB or partitioning — standard PostgreSQL becomes extremely slow for time-range queries across billions of rows |
| Key tradeoff | TSDBs sacrifice general-purpose flexibility (complex joins, arbitrary updates) for extreme efficiency in their specific access pattern (time-ordered writes and range reads) |
Why This Matters
Time series data is everywhere — every monitoring system, IoT platform, and financial exchange generates it. Traditional relational databases struggle with the combination of extremely high write volumes (millions of points per second), time-range query patterns, and the need for automatic data lifecycle management. A general-purpose database that handles 10,000 writes/second chokes when asked to ingest 1 million metrics/second from a Kubernetes cluster. TSDBs solve this with columnar storage for compression, time-based partitioning for efficient range scans, and built-in retention policies that automatically discard or downsample old data.
The Building Blocks
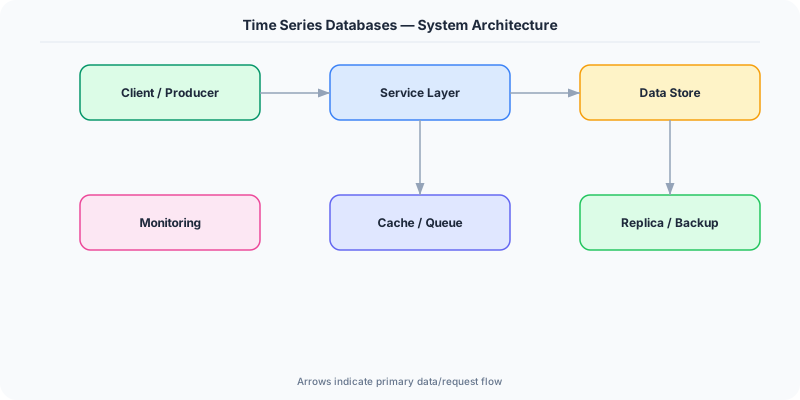
- Time-Based Partitioning: Data is partitioned by time intervals (hours, days). Queries that span a time range read only the relevant partitions, and old partitions can be dropped instantly without expensive deletes.
- Columnar Compression: Storing each metric's values contiguously (columnar layout) enables extreme compression because time series data is highly repetitive — timestamp deltas and similar values compress to a fraction of raw size.
- Downsampling & Retention: TSDBs automatically roll up old high-resolution data (e.g., per-second) into lower-resolution aggregates (e.g., per-hour) and drop raw data after a retention period, managing storage growth.
- Tag-Based Indexing: Data points are tagged with metadata (host, region, service), and TSDBs build inverted indexes on these tags for efficient filtering — e.g., 'CPU usage for all hosts in us-east'.
- Continuous Queries: TSDBs support queries that run continuously on incoming data, computing running averages, detecting anomalies, or feeding real-time dashboards without explicit polling.
Under the Hood
Time series databases exploit three properties of their workload: writes are append-only (data arrives in time order and is rarely updated), reads are time-range scans (give me CPU metrics for the last hour), and old data decreases in value (per-second granularity from 6 months ago is rarely needed). These properties drive every design decision.
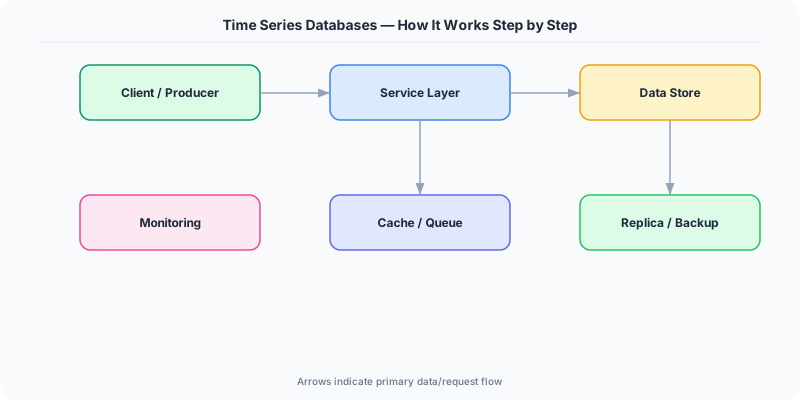
Storage engines typically use a variant of LSM Trees or columnar formats. InfluxDB's TSI (Time Series Index) maps series keys to sorted, compressed data blocks organized by time. Prometheus uses a custom append-only format where each two-hour block contains compressed samples for all series active during that window. TimescaleDB extends PostgreSQL with automatic time-based partitioning (hypertables), leveraging PostgreSQL's B-tree indexes within each chunk.
Compression is critical. A naive representation of a timestamp + float64 value costs 16 bytes per point. TSDBs use delta-of-delta encoding for timestamps (storing the difference between consecutive deltas, which is often 0 for regular intervals) and XOR encoding for float values (storing the XOR with the previous value, which has many leading zeros for slowly-changing metrics). These techniques achieve 1-2 bytes per point — an 8-16x compression ratio. Combined with time-based partitioning that enables instant deletion of old data (drop a partition file instead of issuing millions of DELETEs), TSDBs handle petabytes of metrics data efficiently.
How Companies Actually Do This
Uber Runs M3, their open-source metrics platform built on a custom TSDB, ingesting billions of metrics per day from thousands of microservices. M3 uses a distributed architecture with replication and downsampling to manage storage costs.
Datadog Their monitoring platform stores trillions of data points using a custom time series engine optimized for high-cardinality tag queries, enabling customers to slice and dice metrics by any combination of host, service, and region.
Tesla Collects telemetry from millions of vehicles — GPS, battery voltage, motor temperature — into time series databases for fleet-wide analysis, predictive maintenance, and autopilot improvement.
Common Pitfalls
- High-cardinality tags — creating a unique series for every user ID or request ID produces millions of series, overwhelming the TSDB's index; keep tag cardinality bounded to hundreds or thousands of unique values
- Not configuring retention policies — without automatic data expiration, time series storage grows without bound; always configure retention periods and downsampling rules from day one
- Choosing the wrong granularity — storing per-millisecond data when per-second suffices wastes 1000x storage; match collection interval to your actual query needs
Interview Questions Worth Practicing
- How would you design a monitoring system to handle 1 million metrics per second from a 10,000-node Kubernetes cluster?
- Explain the high-cardinality problem in time series databases and how you'd work around it.
- Compare TimescaleDB (PostgreSQL extension) vs InfluxDB (purpose-built TSDB) for a monitoring use case. What factors would influence your choice?
The Tradeoffs
- Specialization vs Flexibility: TSDBs excel at time-ordered workloads but cannot replace a general-purpose database for arbitrary joins, transactions, or non-temporal queries
- Compression vs Query Speed: Heavy compression reduces storage 8-16x but adds decompression overhead during reads — TSDBs optimize this with block-level caching and vectorized decompression
- Resolution vs Storage: Higher-resolution data enables more precise analysis but grows storage linearly; downsampling reduces cost but permanently loses granularity
How to Explain This in an Interview
Here is how I would explain Time Series Databases in a system design interview:
Frame your answer around the three properties that make time series data special: it's append-mostly (rarely updated), queries are time-range scans (not random lookups), and old data loses value (can be downsampled). These properties drive TSDB design: data is partitioned by time (so range queries read only relevant partitions and old data is dropped by deleting partition files), stored in columnar format (enabling extreme compression via delta-of-delta timestamps and XOR-encoded values — typically 1-2 bytes per point vs 16 raw), and automatically downsampled (per-second → per-hour after 30 days). Mention the high-cardinality trap: if you tag each data point with a unique user ID, you create millions of series and overwhelm the index. Keep tags bounded. Name concrete systems: Prometheus for Kubernetes monitoring, InfluxDB for general-purpose TSDB, TimescaleDB when you want PostgreSQL compatibility.
Related Topics
Original DosiBridge notes for Time Series Databases: Metrics, Retention and High-Write Storage
This section is written specifically for this page, not copied from a general system-design checklist. The useful way to study Time Series Databases: Metrics, Retention and High-Write Storage is to connect the concept to a data path where correctness, access pattern, and future migrations matter more than benchmark numbers. That framing changes the design discussion from definitions to operating choices.
What makes this topic distinct
- Query Shape: For Time Series Databases: Metrics, Retention and High-Write Storage, decide the query shape before choosing tools; otherwise the design looks clean but fails when time changes.
- Write Amplification: For Time Series Databases: Metrics, Retention and High-Write Storage, decide the write amplification before choosing tools; otherwise the design looks clean but fails when series changes.
- Replication Lag: For Time Series Databases: Metrics, Retention and High-Write Storage, decide the replication lag before choosing tools; otherwise the design looks clean but fails when databases changes.
- Migration Safety: For Time Series Databases: Metrics, Retention and High-Write Storage, decide the migration safety before choosing tools; otherwise the design looks clean but fails when time changes.
- Data Ownership: For Time Series Databases: Metrics, Retention and High-Write Storage, decide the data ownership before choosing tools; otherwise the design looks clean but fails when series changes.
Production review question
If a team adopts Time Series Databases: Metrics, Retention and High-Write Storage, what observable signal proves it helped instead of only making the architecture diagram more fashionable?
Practical metric to track
Track time-databases health as a named dashboard or review item: combine one user-facing metric, one saturation metric, and one correctness metric. For Time Series Databases: Metrics, Retention and High-Write Storage, this keeps the discussion grounded in behavior that can be measured after deployment instead of generic advice that sounds good in an interview but never gets verified.